trs_
The trs_ codes are a series of routines for performing coordinate Translation,
Rotation, and Scaling. There is a fourth simple operation: reflection (an image
flip about the X or axis). I wrote an early
document that demonstrates usage of the trs_ transformation routines.
The basic input file used for most of these routines is a simple X,Y data listing
with a "# data" header. Below I list the major trs_ routines and their usage
messages below. I some cases I give a link to a more detailed document which
usually include a demo run and the resultant output.
Probably what you really want to know about:
In this page I am describing the lower level components of the trs_ routines for
coordinate transformation. Most users are intersted in the higher level scripts that
use these routines:
- ds9_xymatch: transform one image to the system of another.
- wcs_markII: derive WCS for an image.
Both of these higher-level codes use the trs_solve_2 script which is described near
the eand of this page.
===================================================================
To generate data:
% trs_make_xy_TestData
Usage: trs_make_xy_TestData 7 0.0 5.0 0.0 12.0 s
arg1 - number of points
arg2 - mean of gaussian 1
arg3 - sigma of gaussian 1
arg4 - mean of gaussian 2
arg5 - sigma of gaussian 2
arg6 - point symbol for pxy_SM_plot.py file
===================================================================


A mored detailed discussion of trs_make_xy_TestData


===================================================================
To build a plot file (used above in trs_make_xy_TestData)
% trs_build_plot_file
Usage: trs_build_plot_file xy.dat r o 100 17 My_"My String"
arg1 - file name of X,Y data (no header)
arg2 - color symbol (r,b,g,...)
arg3 - point type symbol (o,s,...)
arg4 - symbol size (100)
arg5 - size of point name labels
arg6 - descriptive string
===================================================================

===================================================================
TRS routines (all files must have "# data" headers)
(These are OTW codes)

% trs_rotate.sh
Usage: trs_rotate.sh XY.dat 60.0
arg1 - file of input X,Y (with # data header)
arg2 - rotation angle in degrees (- for CCW, + for CW)

% trs_scale.sh
Usage: trs_scale.sh XY.dat 1.36
arg1 - file of input X,Y (with # data header)
arg2 - scale factor

% trs_scaledet.sh
Usage: trs_scaledet.sh file1.xy file2.xy
arg1 - file1 of input X,Y (with # data header)
arg2 - file2 of input X,Y (with # data header)
Ratio computed is file1/file2

% trs_translate.sh
Usage: trs_translate.sh XY.dat 100.0 -25.5
arg1 - file of input X,Y (with # data header)
arg2 - Xo
arg3 - Yo

% trs_reflect.sh
Usage: trs_reflect.sh XY.dat X
arg1 - file of input X,Y (with # data header)
arg2 - reflect axis (X,Y, or N for none)

Here is a demonstration using these routines:
% trs_translate.sh d.0 -1.828 -28.265 > d.1
% trs_rotate.sh d.1 30.0 > d.2
% trs_scale.sh d.2 1.33 > d.3
% trs_scaledet.sh d.3 d.1
       1.33000        0.00001        5
===================================================================
In the last example above I have translated a set of X,Y data (Xo,Yo = -1.828 -28.265),
then I rotated this data set by 30 degrees in the clockwise (CW) direction. The
coordinates were sclaed by a factor of 1.33. Finally, I selected the third point
in my final X,Y set to use the trs_scaledet.sh to derive (and verify) the scale factor
I applied. These steps are all very simple, highly modular, and easy to understand.
A set of higher level scripts has been written. Each script is comprised
largely of calls to the primitives listed above.
===================================================================
To apply all of the coordinate transformation steps:
% trs_apply
Usage: trs_apply file1.xy trs_terms
arg1 - file with XY to be transformed
arg2 - file with TRS terms
arg3 - output header line (Y/N)
===================================================================


A more detailed discussion (with examples!) of trs_apply


===================================================================
An example of the "file with TRS terms":
% cat TRS.terms
  0.0 0.0   N    1.0   30.0   0.0 0.0

------------------------------------------------------------------------------------
Here are the script lines in trs_apply that read these:
# Read the transformation coefficients
read xt2 yt2 reflect fscal theta xf1 yf1 < $ftrs
printf "Terms: $xt2 $yt2 $reflect $fscal $theta $xf1 $yf1\n" > trs_apply.explain
------------------------------------------------------------------------------------

The tranformed X,Y are sent to standard out, but general redirected
to some new file.
===================================================================

===================================================================
Solving for the TRS coefficients (an early version)
*** This DOES NOT include the rotation angle! ****
% trs_solve_1
Usage: trs_solve_1 file1.xy file2.xy 2 1.35 -30.0 N
arg1 - file with XY to be transformed to (Defines system)
arg2 - file with XY to be transformed
arg3 - Point number defining origin (1)
arg4 - scale factor (can be "Q")
arg5 - Rotation angle in degrees (can be "Q")
arg6 - Reflection axis (X,Y, or N for none)
===================================================================

NOTE: a "Q" indicates the script simply queries the user for a value.
Finally, to conduct various experiements, we would like a simple way of
plotting point sets. The first set would presumambly be our input set
(file1.xy) and the second would be transformed (or some intermediate)
set (file2.xy). For this I have a simple plot building script:
% trs_2plot
Usage: trs_2plot file1.xy file2.xy "My Plot of XY"
arg1 - file with XY - Set 1
arg2 - file with XY - Set 2
arg3 - plot title string (in quotes)
Hence, using the (slightly modified) original file from above:
% trs_apply XY0.data TRS.terms Y > XY1.data
% trs_2plot XY0.data XY1.data
% trs_plot.py Style.file -30 30 -30 30 SHOW
I sued the commands above to ccreate the simple demo plot below that shows
our 30 degree rotation.
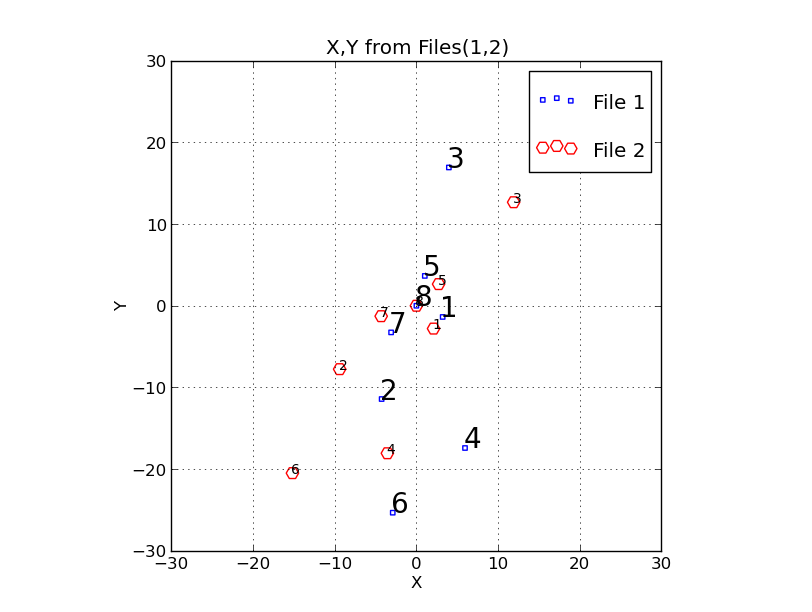 |
We have rotated an original set (File 1 in blue) by 30 degrees about
the origin to prodcue a transformed set (File 2 in red). The commands
to do this and make the above figure were:
% trs_apply XY0.data TRS.terms Y > XY1.data
% trs_2plot XY0.data XY1.data
% trs_plot.py Style.file -30 30 -30 30 SHOW

Note that you can always change Style.file to modify the
axis labels and such.
|
trs_solve_2: The final script
I have described the use of trs_solve_1 above. The trs_solve_2 code is much the
same with the important difference that in addition to using the "Q" (query) input,
we can also use the "S" (solve) input.
% trs_solve_2
Usage: trs_solve_2 file1.xy file2.xy 2 1.35 -30.0 N
arg1 - file with XY to be transformed to (Defines system)
arg2 - file with XY to be transformed
arg3 - Point number defining origin (1)
arg4 - scale factor (can also be "Q" or "S")
arg5 - Rotation angle in degrees (can be "Q" or "S")
arg6 - Reflection axis (X,Y, or N for none)
NOTE:  Q=query  S=solve
NOTE:  local PointNames file must be present
Finally, I note that the trs_solve_2 routine the end-prodcut of a lot of efforts. As
a result, a lot of usesful plotting approaches are available. So many, in fact, that
I can never rememeber how this stuff works! In an effort to put some order to
this I have prepared a general document on TRS-related
plotting.
Back to SCO CODES page