TRS Plotting
Last Updated: Nov12, 2017
- Using the *.plot files.
- Using the *.xy files.
The trs_plot.py code is a package I developed to plot X,Y sets from my trs_ run. Most
importantly, it insures that the two axes are using a uniform scale. In the course of
creating the trs_ routines I ended up making two very similiar (but differet!) types
of files. This unfortunately results into two different plotting tools. The two files
type are explained here:
*.xy   =  the X,Y data with a brief header

*.plot  = a file much like above that has plot info at the top and can
          be fed directly to trs_plot.py

After a typical trs run (like with wcs_trs) I may have files like:
% ls *.xy *.plot
A_Original.plot   file1_original.plot  file1_trans.xy	 file2_original.xy  file2_scal.plot   file2_trans.xy
A_Original.xy	  file1_original.xy    file2_final.plot  file2_rotate.plot  file2_scal.xy
A_Transformed.xy  file1_trans.plot     file2_final.xy	 file2_rotate.xy    file2_trans.plot

Examples:
% cat file1_trans.xy
# XY values from trs_translate.sh
# Input file = list.xy_arc
# Xo,Yo =     -0.00000      0.00000
# data
       0.000        0.000
      -0.662      -48.888
     -19.765      -61.293
     -64.476        3.061
    -116.062      -57.494
    -120.550        5.557

% cat file1_trans.plot
point g s 70 16
F1 Trans
  0.000   0.000 1
  -0.662          -48.888       2
  -19.765         -61.293       3
  -64.476         3.061 4
  -116.062        -57.494       5
  -120.550        5.557 6
Using the *.plot files.
The *.plot files are assembled with bash scripts with no care of formatting. They
are not very easy to read, but easy to use in trs_plot.py. All you need to do is
build a file (Style.1 below) that describes the axis labeling and the then lists
the files to plot. Here is an example.
% cat Style.1
Example of using trs_plot.py
X
Y
file1_trans.plot
file2_trans.plot
% trs_plot.py Style.1 -30 30 -30 30 SHOW
% trs_plot.py Style.1 -700 700 -700 700 SHOW
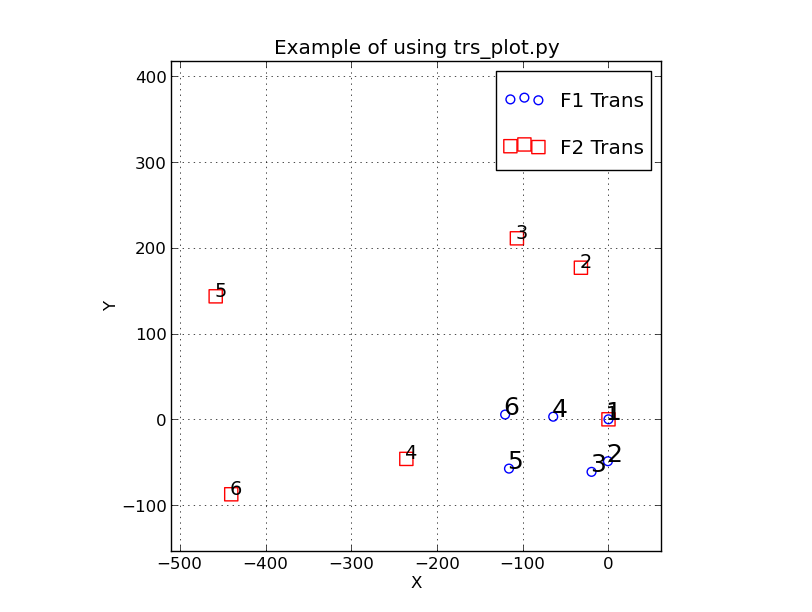
In the Style.1 file I specify that I want to plot two files. The first, file1_trans.plot, has
the X,Y of linearized Ra,Dec in units of arcsec. These have been translated so that the point 1 is
at X,Y=0,0 (the origin). In the second file, file2_trans.plo, we have coordinates for the same targets
in unites of acm pixels. In this case we have also tranlated the coordinates so that target 1
is at the origin. Hence, both sets of points have target 1 plotted at the origin. As we have not
flipped, scaled or rotated the file2 points yet, nothing else lines up. Fianlly, notice that I can set
yhe plot limits on the command line. In the first call I just used a generic set of limits, and all
I saw in the original plot was point 1. I could use the show() tool to easily recscale the plot, but
when I made the second call I used "-700 700 -700 700" and then I could immediately see all of the
points from files 1 and 2.
 |
|
The points from a wcc_trs run. The file1 points (the points defining the system
to be transformed to) are labeled as "F1 Trans" The label is a shorthand description
indicating that these are the File1 points after translation. These are the circular
blue points. They obviously occupy a smaller are and this is because the acm has
a plate scale of 0.271"/pixel. Since the blues points are in arcsecond units, they have smaller
separations thant the file2 points (red squares) which are in pixel units. After the scale
factor is applied in the transformation process our point separations between the two sets
will have the same distances. The one thing we have done by translating
both sets is to now place target 1 at the same poistion in each set.
|
In the above example I changed a few things in the *.plot files that came from the
wcs_trs run. I wanted different point types and sizes, so I changes these by changing the
arguments on the first line. To remember the point types and colors
available I used the Appendix in my XY_with_Tables
document that discusses a broad range of plotting topics. Fiannly, I show a second
plot where I just added another line to the Style file (I called in Style.2). I plotted
the file2 data after applying the scale factor. Now the points occupy the same spatial
area. They do not line up yet becasue the file2 data are not rotated.
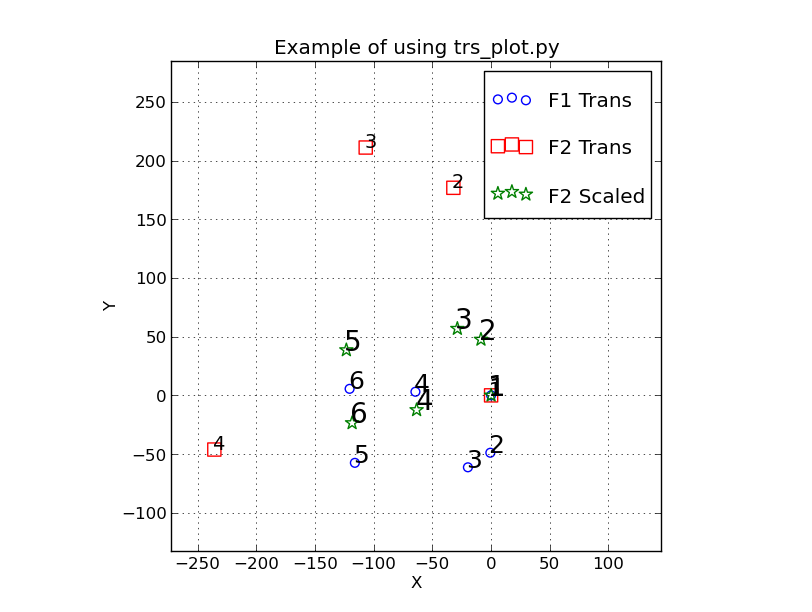 |
The same plot as above, but we have added another point set: the scalled file2 points are plotted
as green stars. Here is the Stlye.2 file we used:
% font color=red>cat Style.2
Example of using trs_plot.py
X
Y
file1_trans.plot
file2_trans.plot
file2_scal.plot
|
Notics that all of the points and labels are making our plot difficult to interpret. Imaging
is we had a lot more that 6 data points in the fit. This leads to my introduction of the
next topic: plotting just two sets of points by directly using the *.xy files.
Using the *.xy files.
Somewhere along the way I decided I wanted a tool that would let me quickly plot
two sets of XY data points. These would presumably be sequential steps in a
trs_ process. The trs_2plot package does this. The only requirement is that
the PointNames file be present. This is a file, used with nearly all of my trs_
codes, that lists the point names for the XY sets in my *.xy files. These are
used to label the plotted points with identifying names. Here is an example of a run:
% ls
file2_original.xy  file2_trans.xy  PointNames
% trs_2plot file2_original.xy file2_trans.xy
Below I show the plot I get from the above exercise.
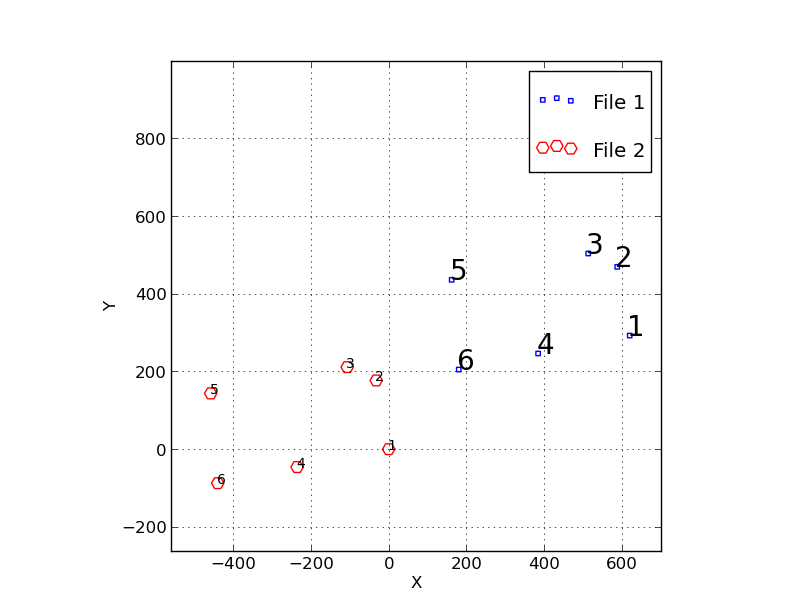 |
An example of a plot from trs_2plot. I made this to debug an apparent
error in a wcs_trs run. From my file Explain_Files.trs_solve_2 (made by
the trs_solve_2 routine) I am told:
file2_original.xy
        The input file2 XY
file2_trans.xy
        The file2 XY after translation (and reflected if requested)
Use the fits point (1) as my translation point. Hence, in the second set
of points (in file2_trans.xy) I should see point 1 at the origin, which I do!
However, these were acm data points and my wcs_trs code was supposed to also
apply the parity flip that I need for an acm image to transform properly.
Obviously this did not occur since the two sets of points (red and blue)
have the same orientation.
|
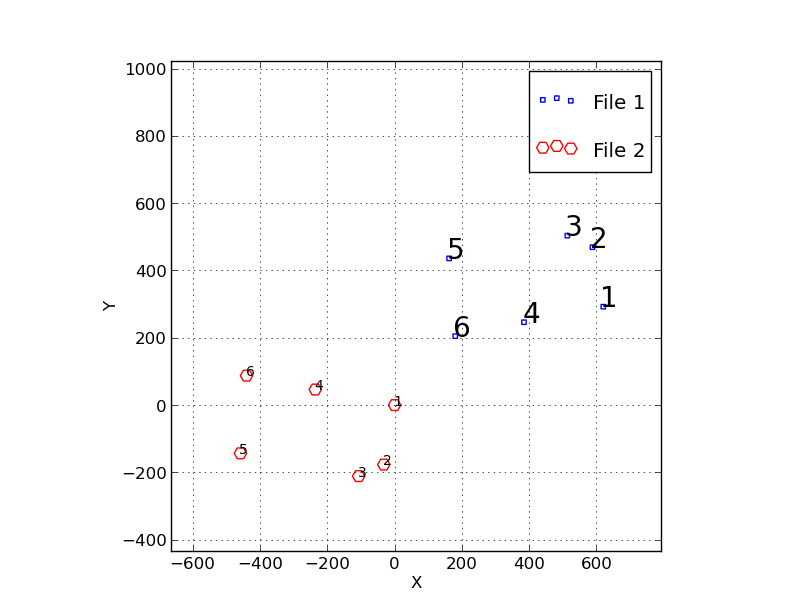
Using the information from the quick plot above, I found that I needed to change wcs_rs so that the
reflection was made about the X axis (reflect="X" going into trs_solve_2) and this immediately
fixed up my problems. Below I show the rsult with the same sort of plot.
 |
|
An example of a plot from trs_2plot after I have flipped the set2 points
about the X axis. Now I can clearly see that I can use a simple rotation to
make the points register with the file1 data (which are not plotted here). The
two sets of points now have a different parity becasue of this reflection process.
|
Back to calling page