trs_make_xy_TestData
This code is used to generate the data files you need for testing or demonstrating
the trs_ codes. It has 3 basic modes of operation:
- Generate random X,Y positions using gaussian distributions.
- Read X,Y positions from a data file.
- Read X,Y positions by interactive query of the user.
Whichever mode you use in running trs_make_xy_TestData, you'll get 4 files producecd:
What are these files?
PointNames == a simple list of the point names
Style.file == a support file for plotting the data with trs_plot.py
XY0.data   == the X,Y data
XY0.plot   == X,Y,Name data (for use by trs_plot.py)
In the examples below I'll show how to generate XY data points for trs_ codes
and then plot them.
- Generating random X,Y points.
- Reading X,Y points from a file.
- Reading X,Y points interactively.
Generating random X,Y points.
A way to produce a set of random X,Y data points is described here.
===================================================================
To generate data:
% trs_make_xy_TestData

Usage: trs_make_xy_TestData 7 0.0 5.0 0.0 12.0 s
arg1 - number of points
arg2 - mean of gaussian 1
arg3 - sigma of gaussian 1
arg4 - mean of gaussian 2
arg5 - sigma of gaussian 2
arg6 - point symbol for pxy_SM_plot.py file

An example run made in an empty directory:
% trs_make_xy_TestData 7 0.0 5.0 0.0 12.0 s
	To plot this data:
	trs_plot.py Style.file -30 30 -30 30 SHOW
	For a typical image X,Y set
	trs_plot.py Style.file 0 1000 0 1000 SHOW

% trs_plot.py Style.file -30 30 -30 30 SHOW
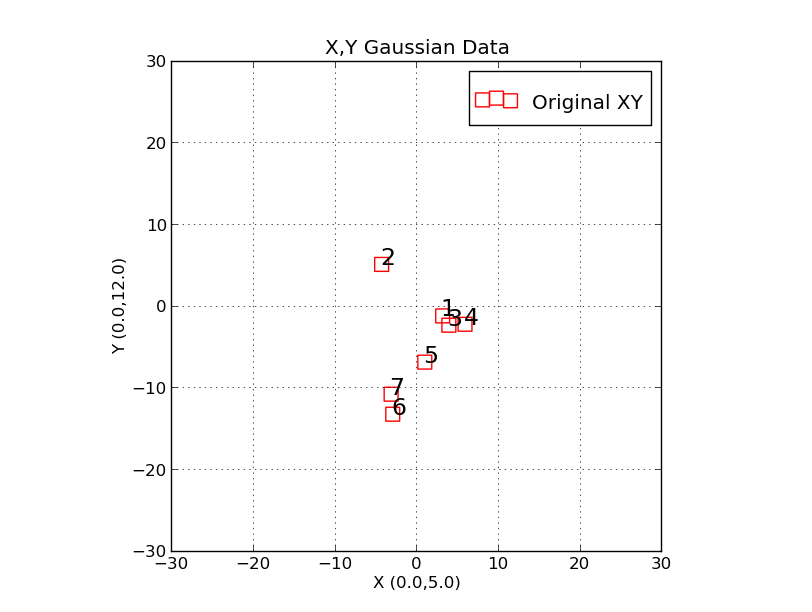 |
Here we have used the script "trs_plot.py" to plot X,Y data points
generated with the "trs_make_xy_TestData" routine. The two command
lines used to generate this plot were:
   trs_make_xy_TestData 7 0.0 5.0 0.0 12.0 s
   trs_plot.py Style.file 0 1000 0 1000 SHOW
Note that I give a couple illustrative examples at the end of trs_make_xy_TestData
aout how to run the plot code. The only real
things to change are the axis limits (xmin,xmax,ymin,ymax) and the
mehod of display (SHOW or HARD). I prefer the SHOW option
since it allows you to easliy resst the plot limits and other properties
of the the plot interacticely. It also lets you produce a hard copy plot.
|
It is useful to see the files generated by the trs_make_xy_TestData run.
% ls
PointNames  Style.file	XY0.data  XY0.plot

Here is XY0.data, a typical trs_ input file:
------------------------------------------------------------------------------------
% cat XY0.data
# X,Y Gaussians (meanX,sigX,meanY,sigY): 0.0 5.0 0.0 12.0
# data
  3.21613	  -1.24125
  -4.25865	  5.06269
  3.97464	  -2.38071
  5.95120	  -2.26620
  1.02907	  -6.90419
  -2.89824	  -13.28160
  -3.09813	  -10.82975
------------------------------------------------------------------------------------

The PointNames file is a fle required by lots of trs_ codes (like trs_solve_2):
------------------------------------------------------------------------------------
% cat PointNames
1
2
3
4
5
6
7
------------------------------------------------------------------------------------

The Style.file file is used for running the plot routine trs_plot.py
------------------------------------------------------------------------------------
% cat Style.file
X,Y Gaussian Data
X (0.0,5.0)
Y (0.0,12.0)
XY0.plot
------------------------------------------------------------------------------------

Finally, the XY0.plot contains the XY data for trs_plot.py
------------------------------------------------------------------------------------
% cat XY0.plot
point r s 100 17
Original XY
  3.21613	  -1.24125	1
  -4.25865	  5.06269	2
  3.97464	  -2.38071	3
  5.95120	  -2.26620	4
  1.02907	  -6.90419	5
  -2.89824	  -13.28160	6
  -3.09813	  -10.82975	7
------------------------------------------------------------------------------------
Even though the user is, afetr running trs_make_xy_TestData, presented with typical command lines for
building a plot, it is useful to know about the command line arguments for the plot routine:
===================================================================
To build a plot file (used above in trs_make_xy_TestData)
% trs_build_plot_file
Usage: trs_build_plot_file xy.dat r o 100 17 My_"My String"
arg1 - file name of X,Y data (no header)
arg2 - color symbol (r,b,g,...)
arg3 - point type symbol (o,s,...)
arg4 - symbol size (100)
arg5 - size of point name labels
arg6 - descriptive string
===================================================================
Reading X,Y points from a file.
Sometimes the user just wants to makeup a few (X,Y) points and
use them to demonstrate how to use different trs_ routines. Here is
an easy way to do this.
# Creat an ASCII file of the X,Y values (no header)
% cat t.1
500 500
500 600
700 500
450 450
% trs_make_xy_TestData read
XY values will be read, not generated.
Enter name of XY file (int for interactive read mode): t.1
At the end of this run you'll have the same set of files as in the
previous section. Below is a plot I generated with the SHOW option
where I altered the initial axis range and plot scale to better suit the
distribution of data point. Note also that I changed the text strings on the
plot labels by just editing thelines in Style.file.
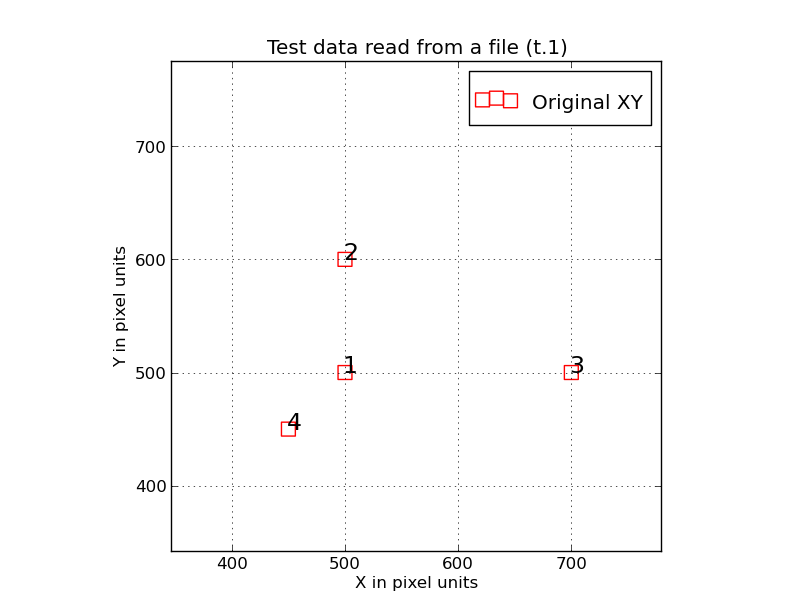 |
Here we have used the script "trs_plot.py" to plot X,Y data points generated with
the "trs_make_xy_TestData" routine run using the "read" mode. The two command
lines used to generate this plot were:
trs_make_xy_TestData read
trs_plot.py Style.file 0 1000 0 1000 SHOW
The file I read to make the 4 points above was:
% cat t.1
500 500
500 600
700 500
450 450
Notice that each ploint is labeled with its name specificed in the PointNames
file. The simple pattern above should be easily recognizable after just any kind of
trs_ transformation, but the point labels should make this even easier. The point
labeling is a useful feature in trs_plot.py, and another is that the
X and Y axes have the same spatial scaline (i.e. an aspect ratio of unity).
|
Reading X,Y points interactively.
This final example needs little explanation. It is just like the previous
example, except the user (after entering "int" as the file name) can
interactively specify (X,Y) point values. If you just want a quick
example, with no file preparation or sets of input paramters established, this is
your choice.
% cat t.1

% trs_make_xy_TestData read
XY values will be read, not generated.
Enter name of XY file (int for interactive read mode): int
Enter x,y(-99 -99 to stop): 10 10
Enter x,y(-99 -99 to stop): 15 20
Enter x,y(-99 -99 to stop): 30 10
Enter x,y(-99 -99 to stop): -99 -99

	3 X,Y points were read.

	To plot this data:
	trs_plot.py Style.file -30 30 -30 30 SHOW
	For a typical image X,Y set
	trs_plot.py Style.file 0 1000 0 1000 SHOW
Back to calling page