- Analysis of many nights.
- Individual images over many nights.
Analysis of many nights.
The acm bias frames are usually taken during the afternoon HET Opeatrions checkout.
# Remember BaseDir file
[sco@vdas 2018-2020]$ cat BaseDir
/hetdata/data
I typically run this analysis on vdas.
[sco@vdas 2018-2020]$ pwd
/home/mcs/sco/ACM_BIAS_STUDY_Jul2020/2018-2020
To get the list of dates I want to review:
% datelist.sh 2018 -ny 3 > list.2018-2020
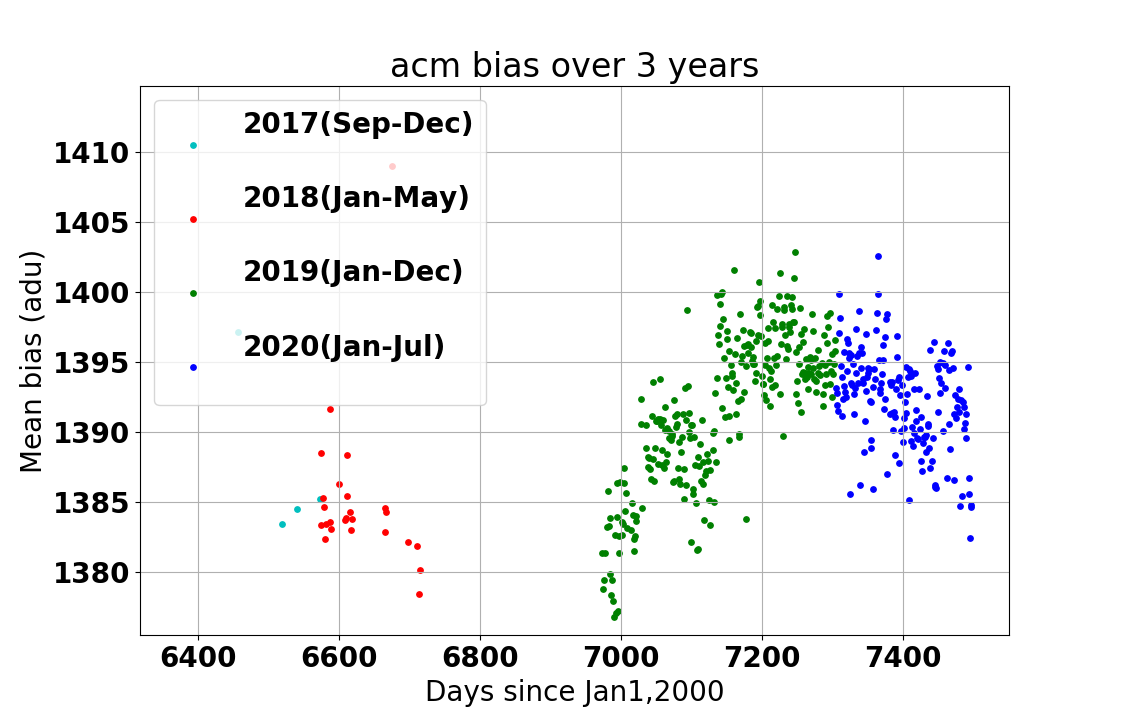
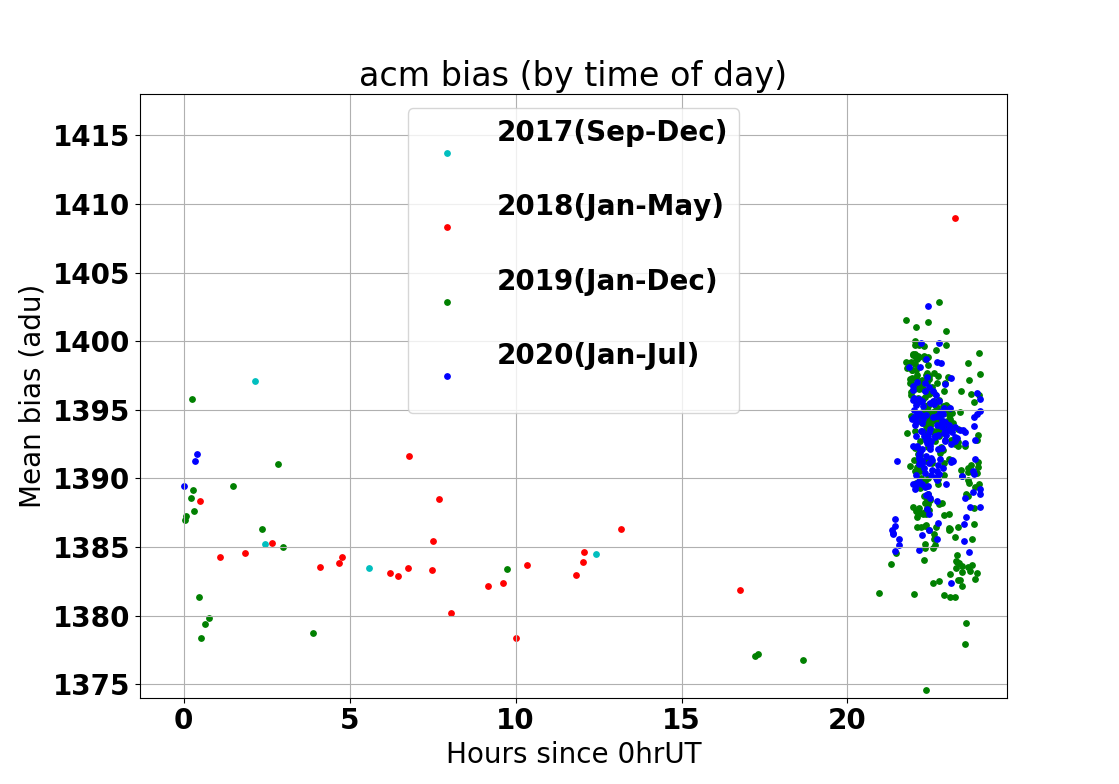
Here I have made a list for 3 years of acm bias images (2018 to 2020)
To run the initial compilation of bais data:
[sco@vdas 2018-2020]$ multi_acm_bias list.2018-2020
This job took about 4h45m to complete and collected bias statistics from 495 nights.
A summary of the data comse in the form of a table file: multi_acm_bias.parlab,table.
I made some initial plots (below) to illustaret some of the results. Note that for
for these plots with xyplotter I experimented
with using a local version of the file named matplotlibrc. Here are some notes from that:
See my notes in /home/sco/Installs/install_sco2019_20200305/codes/python/plotting/Notes_from_SCO/README.jul12_2020

Later I found how I change rcParams values within the code (from my interactive cursore code).
#=========================================================
# experimental
paramso = {'savefig.format'       : 'png',
          'figure.figsize'       : [9.0, 9.0],
          'font.size'            : 15,
          'axes.formatter.limits': [-3, 3]}
plt.rcParams.update(paramso)
#=========================================================

So I stuck this in pxy_SM_plot.py:
#=========================================================
# experimental ----- Jul2020
paramso = {'savefig.format'       : 'png',
          'figure.figsize'       : [12.0, 9.0]}
plt.rcParams.update(paramso)
#=========================================================
Now I get a much better size for plots that go into webpages (and that I can see!).