xyplotter and xyplotter2
Updated: Aug09,2020
The xyplotter code allows us to plot data sets from multiple table files.
In Aug2020 I added the capability to plot text strings and I refer
to this (for now) as xyplotter2. You can see an example of
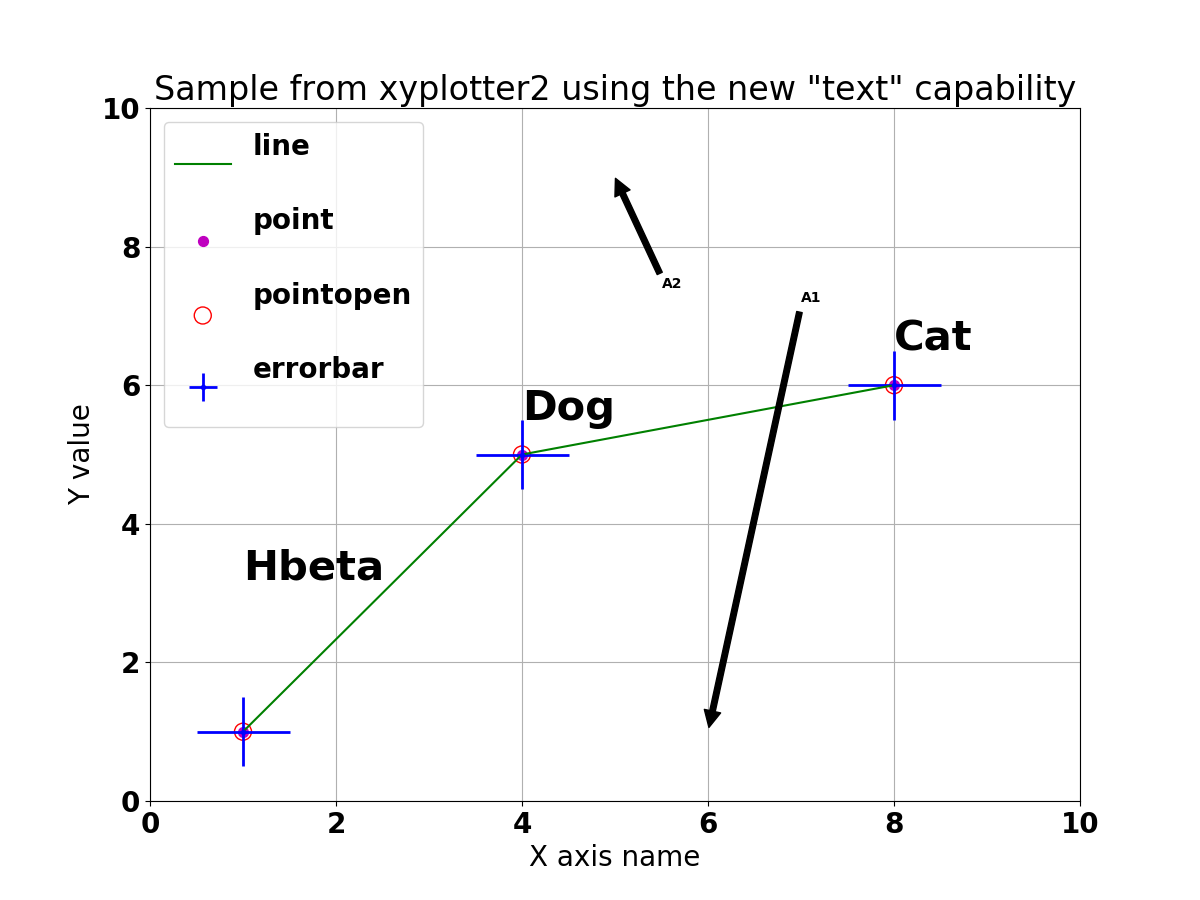
how to plot every type of symbol
with xyplotter2. This example was used to make the plot in the figure below.
Note that I usually build my initial plot with the
xyplotter_auto routine. Becasue the "text" and
"arrotext" plot types were added long after the development of most of my plot
routines, these plotting types are not available in xyplotter_auto .
You can add these with runs of xyplotter2.
 |
|
This is a sample plot made using xyplotter2. It shows every type of
symbol I can make with this code, including plotting text strings.
Note that I have changed the size of the text labele when I changed from
plotting "text: to "arrowtext".
See the example of how to plot every
type of symbol with xyplotter2. The real plooting is actually done
with the matplotlib routine .../codes/python/plotting/pxy_SM_plot2.py.
|
The development of xyplotter and detailed discussions of the routines that
drive it can be found in a general
discussion of plotting data with table files. In this cuurent doc
I give the basic calling syntax for xyplotter followed by some illustrative
examples. The basic ide here is that we must have prepared two basic input
file: one that describe what table files are to be plotted (and how), and
the second describes the axis scaling and labeling as well as a title for
the plot. We'll give some sample calls first to demonstrate the synatx:
% xyplotter
Usage: xyplotter List.1 Axes.1
arg1 - Name of basic xyplotter input file
arg2 - Name of axis information file

% xyplotter --help
xyplotter:
  Build plot files from ASCII table files and process them
  with the xyp_SM_plot.py routine.
The first file on the command line (arg1) lists the files to be plotted,
and the second file (arg2) specfies the axis labeling and sizing. Below
I give examples of how this routine is used, but a good place to start, once
you have a tablefile, is to use the
xyplotter_auto to plot one set of data. After that, making the jump to
multiple sets just involves more lines to the arg1 file (List,1 in the
sample call above).
I wrote a script named mpl that provides a
brief summary of point type a color properties.
Example 1: Plot data from multiple files
Here we'll plot X,Y data sets pulled from multiple table files. You can use
the link here to grab the Ex1 tar file. When
the tarball is downloaded (probably to your Downloads directory) you can unpack
it and descend into the example directory and run xyplotter. You can read about
all of the steps for this here.
Example 2: Using error bars in a multi-plot
Here we'll plot X,Y data sets pulled from multiple table files. For the first set
I use errorbars. You can use the link here to grab the
Ex2 tar file. When the tarball is downloaded (probably to your Downloads directory)
you can unpack it and descend into the example directory and run xyplotter. You can read about
all of the steps for this here.
Back