Mean acm bias levels from Sep2017 to Jul2020
Last updated:Jul24,2020
Summary: I discuss properties of the
HET acquiisition vamera (acm) bias level. The mean acm bias levels, corrected for
a significant fixe bias pattern, are plotted for indiviual images as a function of
time in days to search for seasonal changes since 2017, and in units of hours to look for trends
throughout a typical night. The last two figures below (7A,7B) illustrate the most important
property found thus far: the mean bias level measured during RA Ops in the afternoons is
approximately 8 adu higher than the bias levels measured during the night.
I used two routines (multi_acm_bias,acm_bias_singles) to study the mean
bias levels of acm images taken from Sep2017 to Jul2020. The first routine
assembles mean bias images for each night. This is basically the method I have
used to assemble nightly bias correction frames. The mean fixed bias patterns from
these nights are used to correct on-sky images (via the codes
pasa and paga.
Bias statistics assembled with the routine acm_bias_singles are presented here.
A summary of the 4 basic sets broken down by year:
Date_Range       Symbol_color   Number(nights)  Number(images)
2017(Sep-Dec)       cyan             4               525
2018(Jan-May)       red             29               852
2019(Feb-Dec)       green          291              2065
2020(Jan-Jul)       blue           183              1073

I do this work in: /home/sco/BIAS_Study_Jul2020/
  See:  Runs_vdas_Jul17_2020, Runs_vdas_Jul23_2020
These data were collected with runs on vdas on Jul16,2020. The most baisc result
from acm_bias_singles is the mean bias over time given below in Figure 1.
 |
|
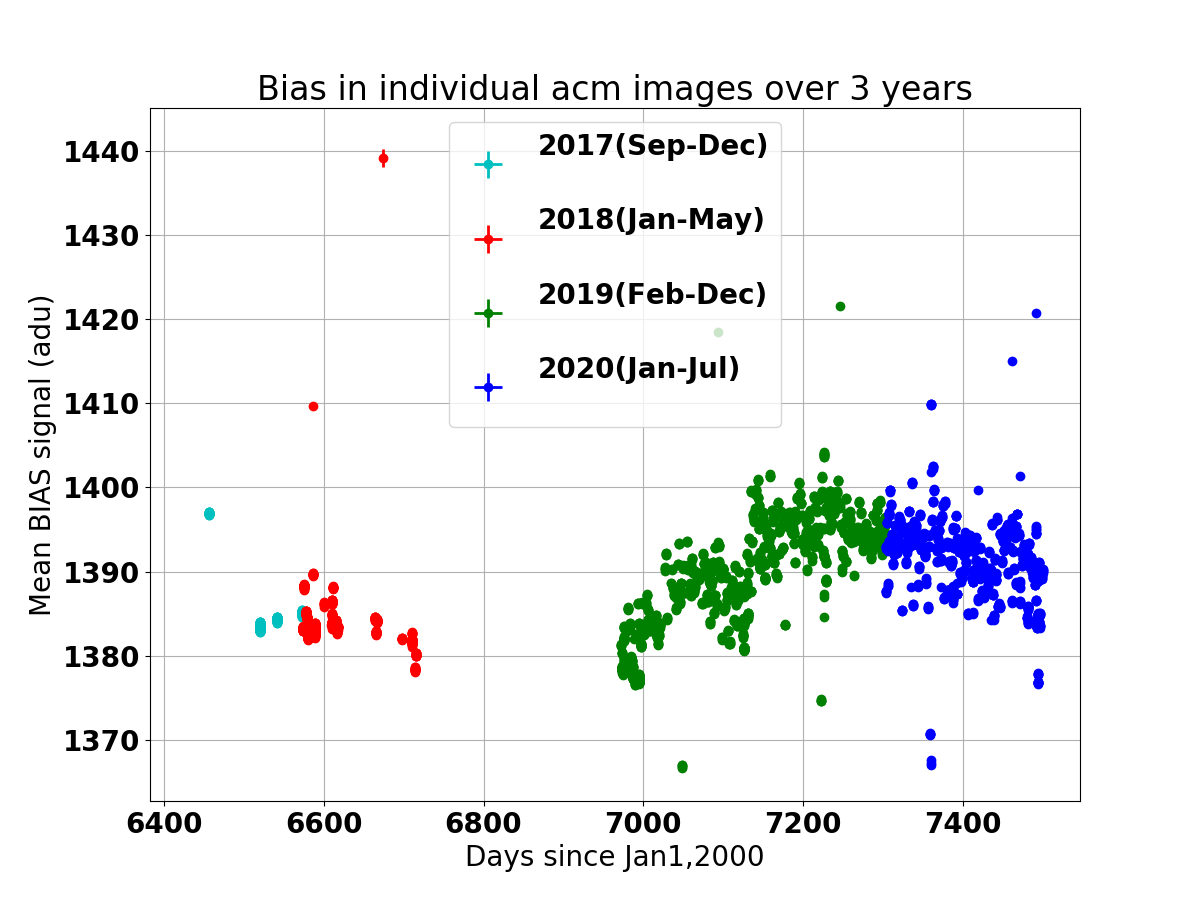
The mean bias level, after subtraction of a fixed bias pattern (FBP),
as a function of date. The date is given as the number of days since Jan1,2020.
After the FBP is subtracted, the mean bias of the image is taken as the mean level in
a box specifieid in iraf notation by [100:700,100:700]. The mean bias from such corrected
images are plotted on the Y axis above. Here we see that in the winter of 2018 the bias
leveles were around 1385 adu. In Feb2019 the mean bias was still around 1385, but by Jan2020
this level had risen to 1395 adu. All of these images are plotted with error bars given by the
standard error about the mean bias. At the scale of this plot this standard error is smaller
than the size of the plotting symbols.
|
 |
|
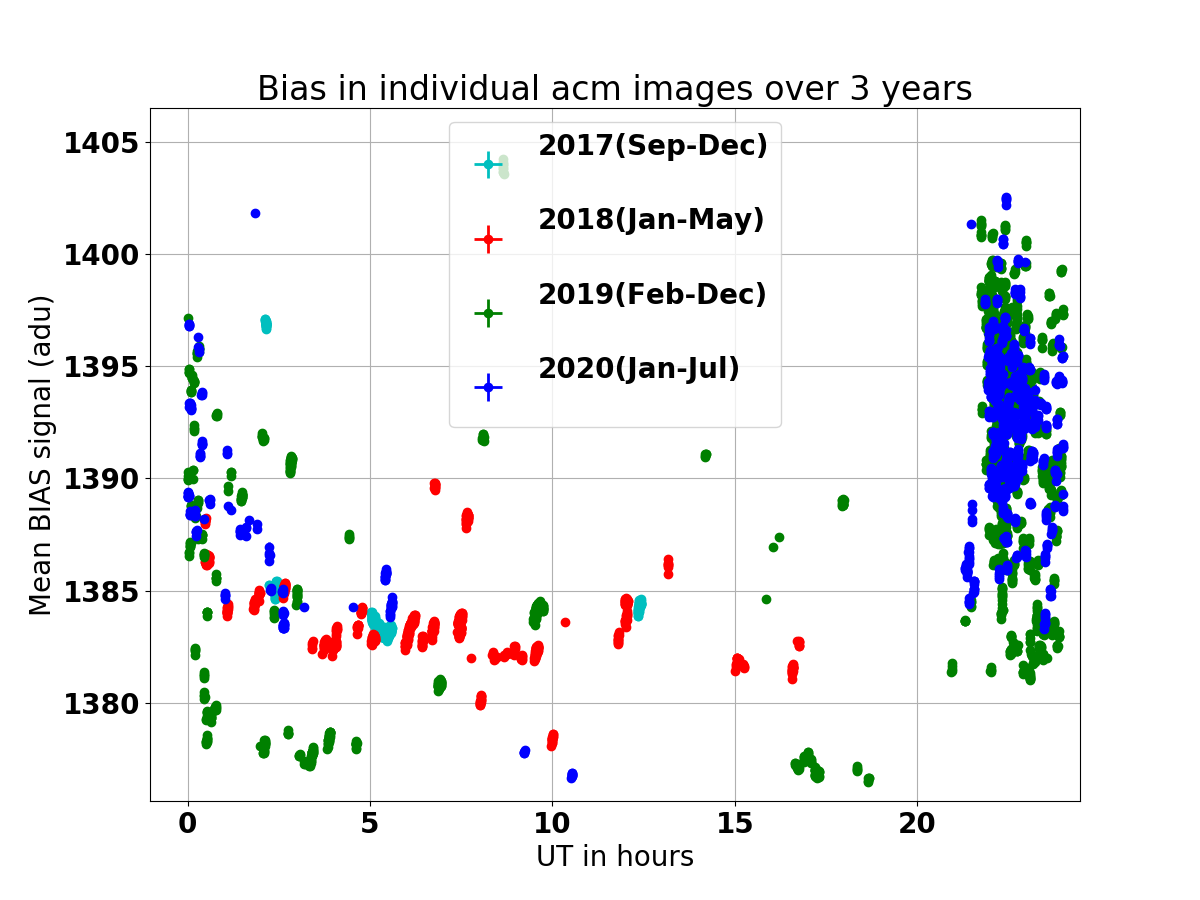
Figure 2: Using all of the data in Figure 1, we now plot the time in (floating point)
UT hours on the X axis and the mean bias on the Y-axis. I retain the year
color-coding of Figure 1, but in this way we can search for trends throughout
a typical night. It seems clear that the points around 22 hours, taken
during afternoon Ops, have a statistically significat higher mean bias level. Note that
this is not simply due to the mean rise in bias from early 2018 to the present. We see many
low bias values among the green abd blue (2018 and 2019) points when they are taken
during the night periods between 0h and 10h. There is a hint in these data that there may be a
general decline in mean bias relative to the "Ops period" values during the first few
hours of a night.
|
The two previous figures are composed of roughly 4500 point. Because they are
displayed with the matplotlib show() function we can easily zoom into small time
windows and isolate sets of bias images that were taken together in one sequence.
In Figure 3 below I show such a data set. Here we see images taken over
a period of about 18 minutes. Now we can see the error bars of the men bias values.
These error bars were specified using the mean error of the mean (or standard
error), which is the standard deviation divdied by sqrt(N-1).
 |
|
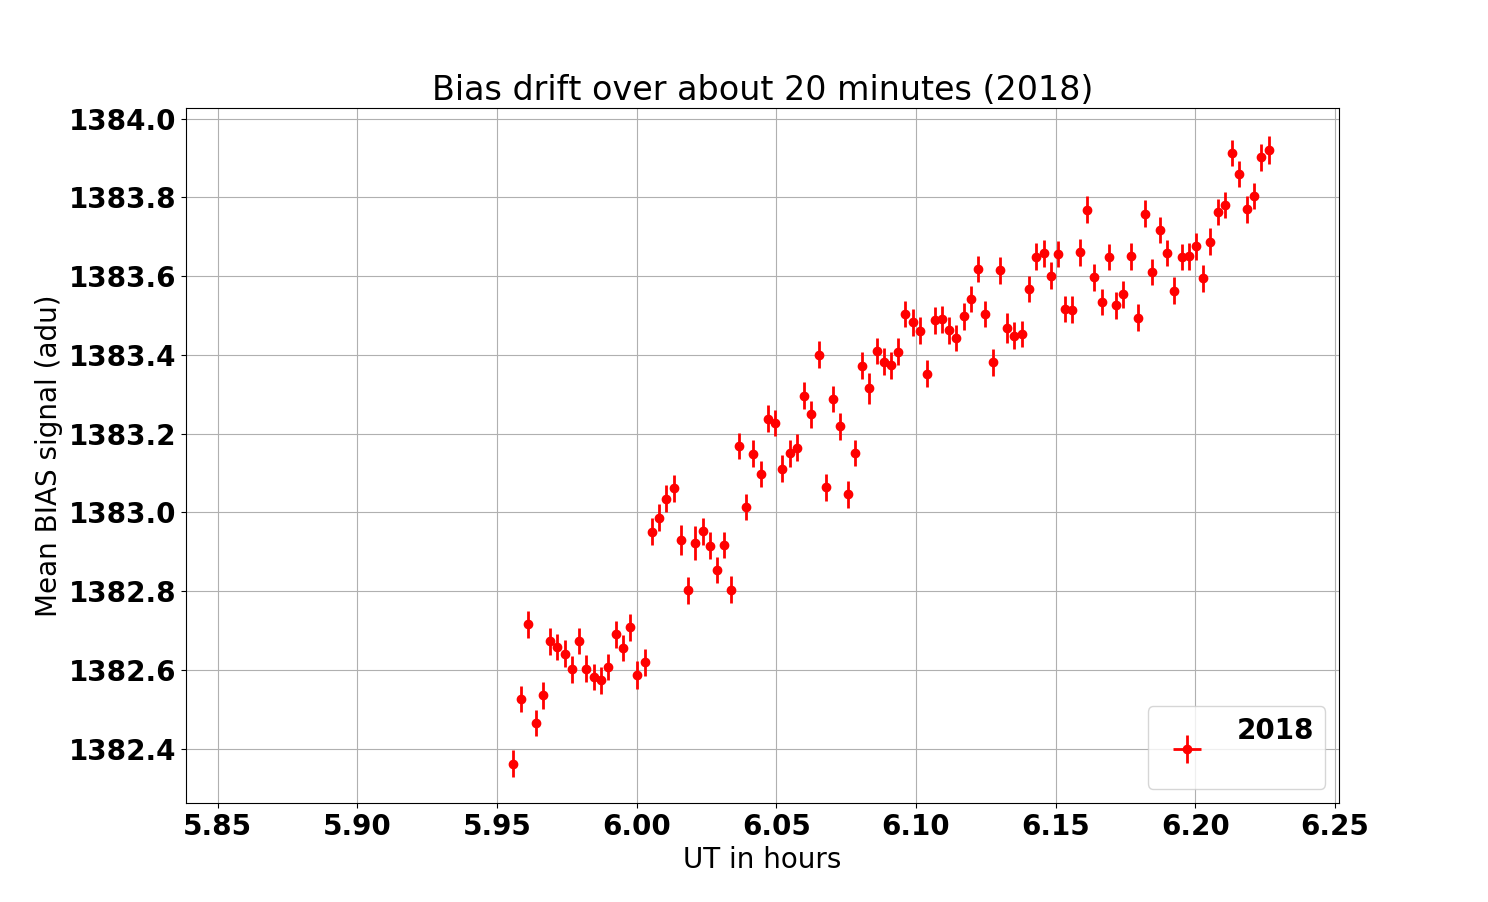
Figure 3: Here we see the mean bias levels for a set of bias frames taken in 2018
that covered about 18 min of time. The errorbars are the standard deviation
about the mean values derived in each case using 361201 pixels covering
the central region of each image. Hence, the bias levels per frame are
quite well determined and the systematic drift of about 1.6 adu over 18
minutes is statistically significant. Since the mean sky level in a 5-sec g image with
acm in a dark sky is about 40adu, this represents a 2% error. Such drifts may be
common over the night and clearly argue for a bias overscan in the acm image
acquisition.
|
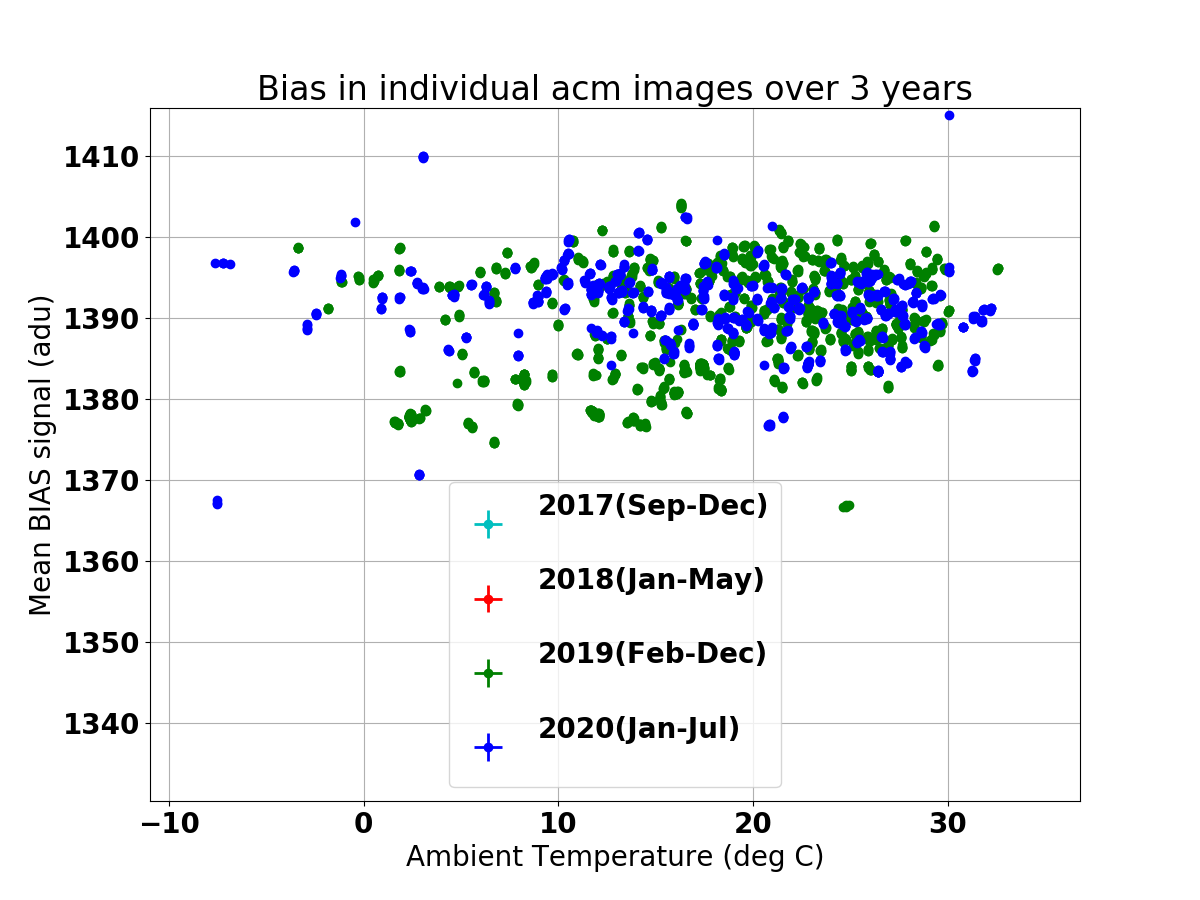
The source of the bias drift observed in acm images is unknown, but temperature change
was supsected as a possible casue. In Oct2018 we began recording the the ambient
temperature values in the acm image FITS headers. In Figure 4 below we see the
mean bias levels plotted as a function of temperature. No strong trend with
temperature is evident.
 |
|
Figure 4: The mean bias level as a function of ambient temperatures. No strong
trend in mean bias level with temperature is evident. However, it does appear
that the 2018 bias levels show a greater variation over the course of the year.
|
 |
|
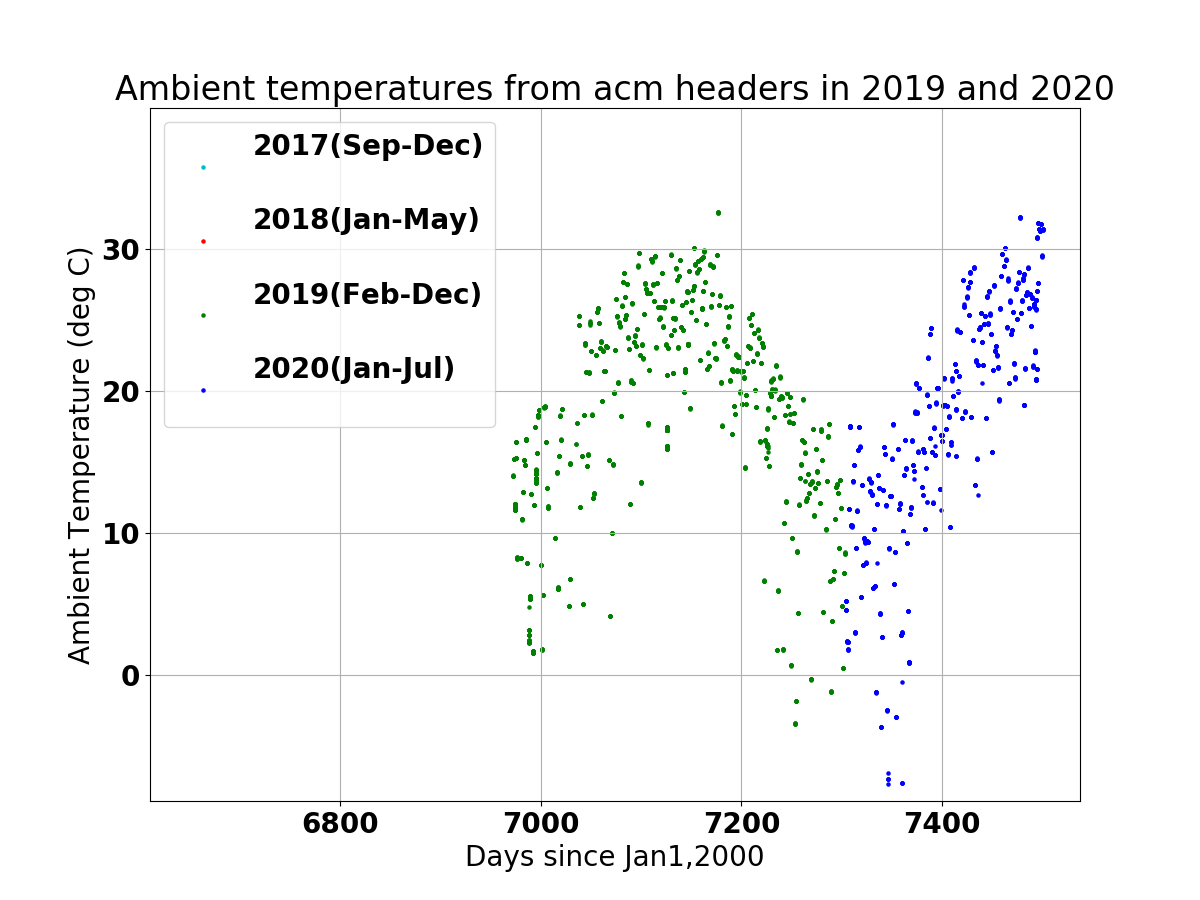
Figure 5: The ambient temperature as a function of date. This is just a snity check to
show that we clearly see the cyclical change in temperature throught the years.
I believe the ambient temperature began apperaing in the acm headers in Oct2018, and
hence we have no temperature data for the 2017 and 2018 data sets discussed
in this document. However, in the 2019 and 2020 sets we see that bias images
were collected in roughly two cold periods and two warm periods.
|
During my mid-July 2020 HET observing run we had very poor weather that
forced closure of the HET. I took a large number of acm bias frames during these nights
to investiaget some of the trends implied in the above figures.
 |
|
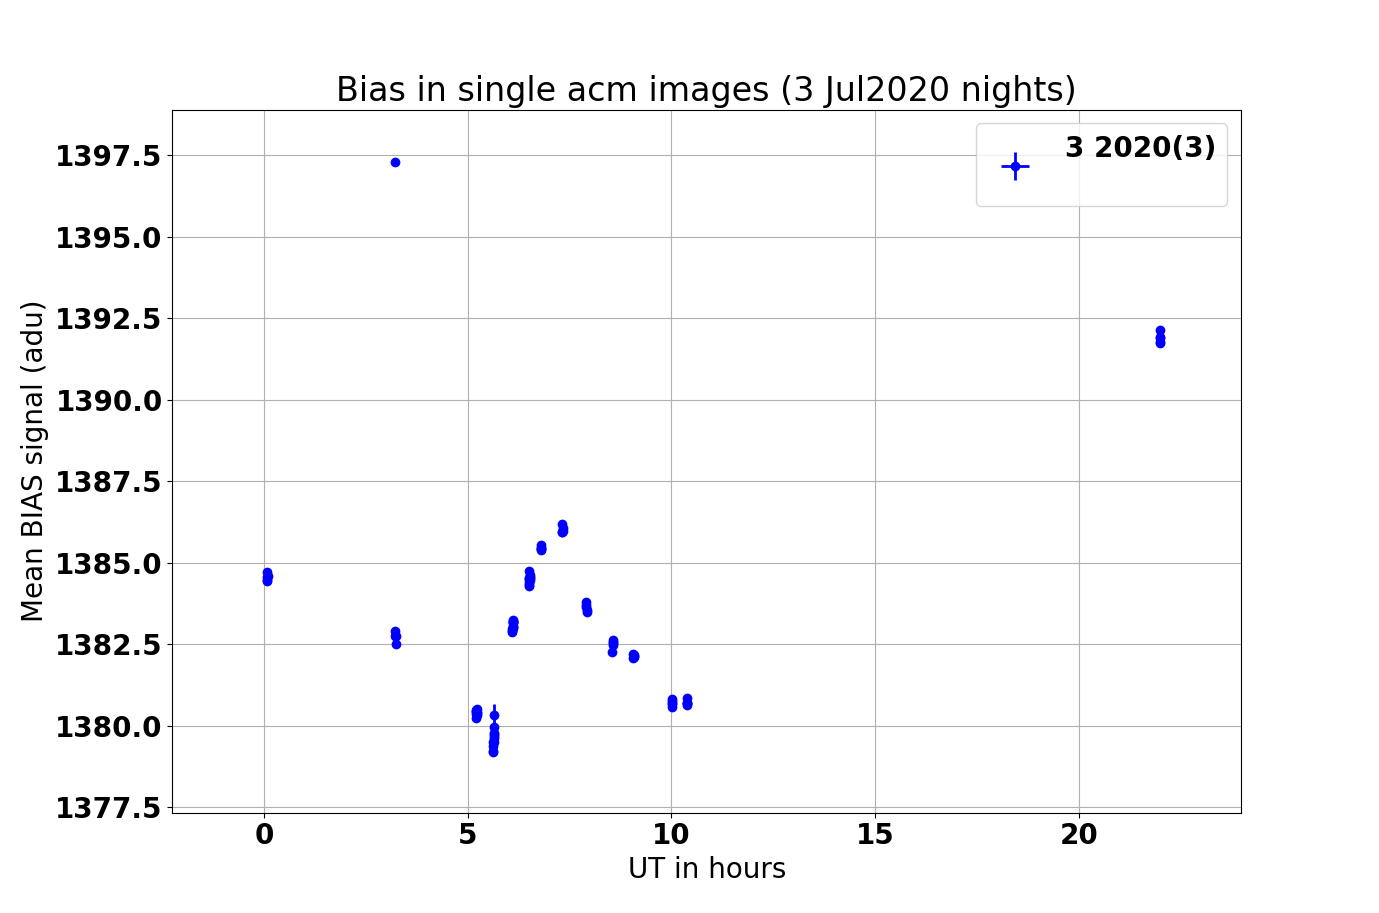
Figure 6: Here we see mean bias levels (after fixed bias pattern correction) for bias
frames gathered on 3 days in Jul2020. The 20200716 and 20200717 are
the usual bias frames taken during afternoon (22 hours UT) Ops. The other points
are from bias frames that I took throughout the closed-dome night of 20200719.
Here we see a fairly large systematic drift of the mean bias level through the
night. We also see a very large discrepant point at bias = 1397.5 adu, a value
from a single bias frame that is very different from all of the others. Note that
the drift during the night covers the range of 1380 adu to 1385 adu, and the mean
bias we would derive using the afternoon measures (as is our practice) would be
around bias = 1391.5 adu.
|
 |
|
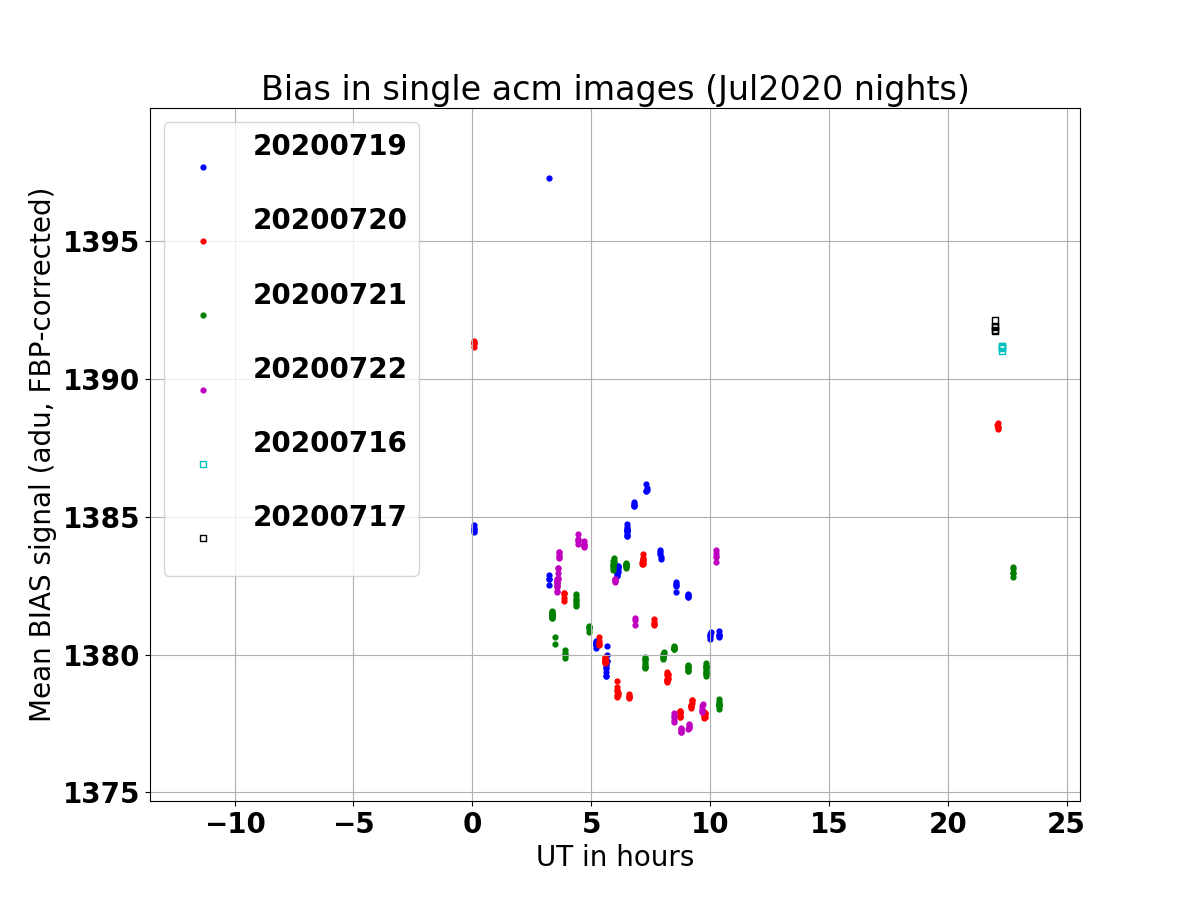
Figure 6B: Here we see mean bias levels (after fixed bias pattern correction) for bias
frames gathered on 6 days in Jul2020. The "afternoon" points are those taken around 22hrs,
and alos a couple sets around 0hr (when weekend Ops was done later in the day). The other
points are from bias frames that I took throughout the four closed-dome nights of 20200719
to 20200722. Here we see a clear difference between mean bias values obtained in the "afternoon"
and "night" sets. We also can see hints of fairly systematic drift of the mean bias level
through the night. The very large discrepant point at bias = 1397.5 adu is a value from a
single bias frame that is very different from all of the others. This is mysterious and
distressing. Note that the drift during the night covers the range of 1377 adu
to 1385 adu, and the mean bias we would derive using the afternoon measures (as is our
practice) would be around bias = 1388 adu.
|
Since there is an apparent difference between the acm bias levels measured during the night
and those measured from images taken during afternoon Ops, I have attempted to quantify this.
In the two plots below I show the bias measurements from all iamges taken in the 2017 to 2020
time frame (Figure 7A) and those taken in July2020 (Figure 7B). In each case I have computed mean bias levels
for bias frames taken in the "day" (usually around 22 hours UT) and during the "night"
(usually 4 UT to 10 UT). In each set I have computed the difference between the bias in the day
and night and referrred to this difference value in the figures below as "Bias Del". I am looking
at more robust ways of computing this offset and its associated rms scatter, but these illustrative
plots are useful for now. The fact that we get an offset of around 8 adu with each of these rather
different sets gives us some confidence that this is a real trait in the acm bias levels. Since the
bulk of our bias fraems have been obtained in afternoon Ops we'll have to incorporate this shift into
the photometry we derive from the nighttime images.
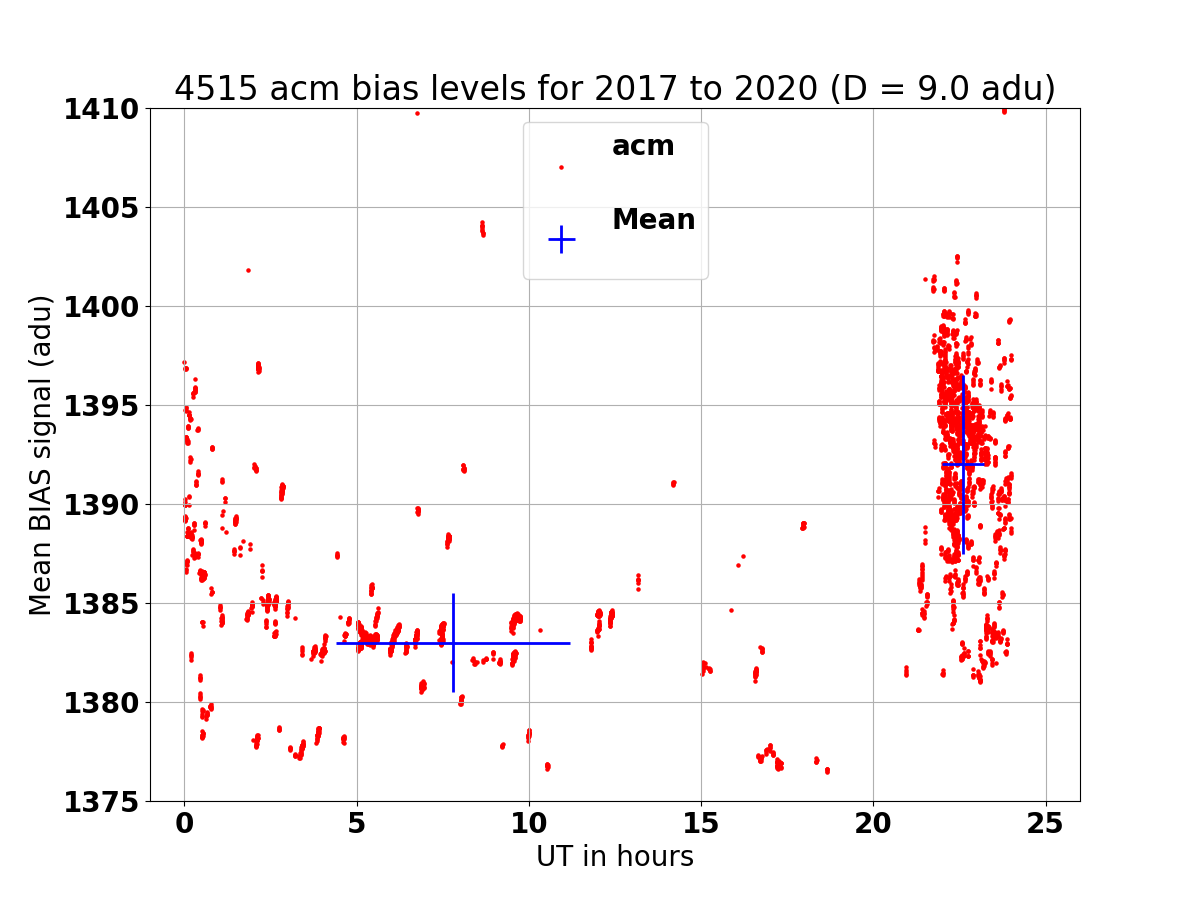 |
Figure 7A: Bias levels (after FBP correction) from about 4500 acm bias frames
taken from 2017 to 2020.
   UT   range   Bias   sig     N
   7.8   3.4    1383.0 2.5    1580
  22.6   0.6    1392.0 4.5    2272
 Bias Del = 1392.0 -  1383.0 = 9.0 adu
|
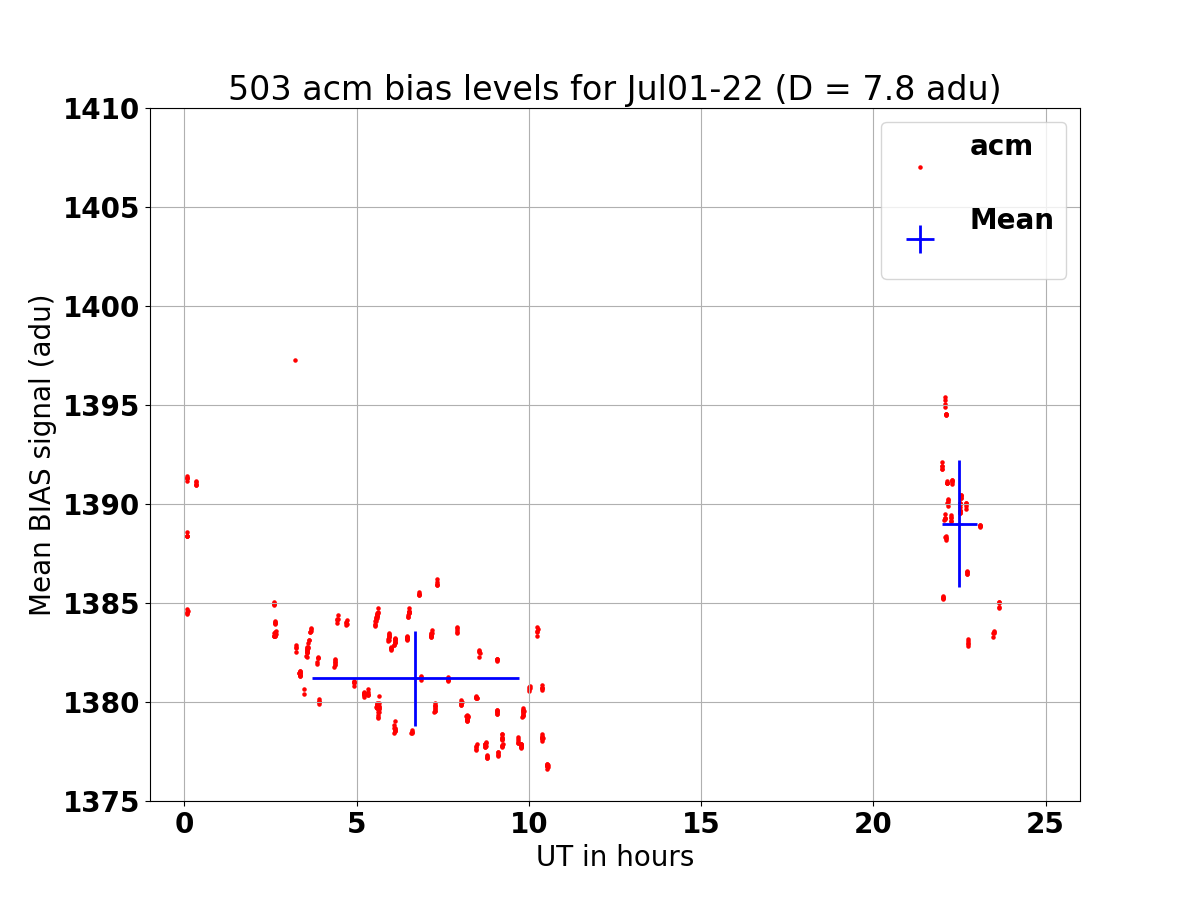 |
Figure 7B: Bias levels (after FBP correction) from about 482 acm bias frames
taken from Jul01 to Jul22 in 2020.
   UT   range   Bias   sig    N
   6.7   3.0    1381.2 2.4    388
  22.5   0.5    1389.0 3.2     94
 Bias Del = 1389.0 -  1381.2 = 7.8 adu
|
Back to calling page