Primary List
- Why am I doing this (again)?
- An example of a numpy array.
- Read a numpy array from a file (Really easy!) and address single elements.
- Using a FITS image as input.
- A numpy image processing example from Greg Ziemann.
- Using numpy np.meshgrid() function.
- np.nanmean(): holy shit!
- Putting things together: Using numpy's loadtxt and nanmean to assemble a cube.
Web tutorials and Lectures
(Basic and Clear) NumPy Tutorial: Example-based Guide
(Okay for first 45min) Introduction to numerical computing with numpy - SciPy2019 - Alex Chabot-Lecler
(Terse with details, but useful) Using NumPy's loadtxt method
Why am I doing this (again)?
In Aug2020 I encounted a multi-extension FITS file that needed
to be numerically manipulated. These operations were trivial,
but reading this 3-d image data into memory using a fortran program
has proven problematic This leads me
to look, yet again, at using astropy and numpy.
Just as I use astroquery in astropy to get catalogs from PANSTARRS, I might
use the fitsio library in astropy to read FITS images and tables. I have little
idea how they work, but as long as they work, what do I care? What I do need is
to brush up on some python skills so that I can perform basic numerical tasks
on the pixels of an image. Thst is the reason for this doc.
Each section below handles a somewhat different aspect of using numpy or some other
python concepts. Each section is built about a single code. The souce codes, for now,
reside in /home/sco/NumPy. Note that I keep an updated copy of this work directory
in my html code: $scohtm/scocodes/Work/NumPy.
Return to top of page.
An example of a numpy array.
Here is a simple code to get going. The souce, for now, code is in /home/sco/NumPy.
Basically I define some lists and show how to assemble them into a numpy data array
(or ndarray). I add some extra things that remind me how to determine the type of a
given entity, how to print out properties of the entity, etc.... I remind myself what a
tuple is, and I try not to let myself be bothers by the OO-worlds love of just
making up new words.
#!/usr/bin/env python

# I use examples from
# https://towardsdatascience.com/the-ultimate-beginners-guide-to-numpy-f5a2f99aef54

import numpy as np

# Make 3 lists of values
row0 = [  1.1, 2.2, 1.3, 1.4, 1.5 ]
row1 = [  2.1, 2.2, 2.3, 2.4, 2.5 ]
row2 = [  3.1, 3.2, 3.3, 3.4, 3.5 ]

# Establish the numpy array named A
A = np.array([ row0, row1, row2 ])

print "\nHere is the numpy array A: \n",
print A

# Now store the data as a numpy array
print "\nProperties of A:\n",
print "Type of A         = %s \n" % ( type(A) ),
print "Type of A.shape   = %s\n"  % ( type(A.shape) ),
#print A.shape

#=================================================================
# A.shape is a tuple (a tuple is a list of strings)
# To dump all of these trings into one easily printed string
# we use the join method to put all of strings of the tuple (A)
# into a single string (that I name line1)
line1 = ' '.join(str(x) for x in A.shape)
print "A.shape as a single string (line1) = %s\n"  % ( line1 )
#=================================================================

print "\nHere is A[1,3]: \n",
print A[1,3]

print "\nHere is row 2 (index=1): \n",
print A[1,:]

print "\nHere is column 5 (index=4): \n",
print A[:,4]

# I can slice the A array
print "\nNow I am slicing the A[1,:], or the first row: \n",
slice0 = A[1,:]
print slice0
print "The type of slice0 is: ",
print type(slice0)
print "Mean of slice0 = %8.3f \n" % ( slice0.mean() ),
print "Min  of slice0 = %8.3f \n" % ( slice0.min() ),
print "Max  of slice0 = %8.3f \n" % ( slice0.max() ),

# I can slice the A array
print "\nNow I am slicing A[1,0:3], or a part of the first row: \n",
slice1 = A[1,0:4]
print slice1
print "The type of slice1 is: ",
print type(slice1)
print "Mean of slice1 = %8.3f \n" % ( slice1.mean() ),
print "Min  of slice1 = %8.3f \n" % ( slice1.min() ),
print "Max  of slice1 = %8.3f \n" % ( slice1.max() ),


% python 2darray_ex1.py

Here is the numpy array A:
[[1.1 2.2 1.3 1.4 1.5]
 [2.1 2.2 2.3 2.4 2.5]
 [3.1 3.2 3.3 3.4 3.5]]

Properties of A:
Type of A         =
Type of A.shape   =
A.shape as a single string (line1) = 3 5


Here is A[1,3]:
2.4

Here is row 2 (index=1):
[2.1 2.2 2.3 2.4 2.5]

Here is column 5 (index=4):
[1.5 2.5 3.5]

Now I am slicing the A[1,:], or the first row:
[2.1 2.2 2.3 2.4 2.5]
The type of slice0 is:
Mean of slice0 =    2.300
Min  of slice0 =    2.100
Max  of slice0 =    2.500

Now I am slicing the A[1,0:4], or the first 4 elements of row 1:
[2.1 2.2 2.3 2.4]
The type of slice1 is:
Mean of slice1 =    2.250
Min  of slice1 =    2.100
Max  of slice1 =    2.400
This simple example seems to work! In this 2-D case, the ndarry is
referenced in the order or roows and then columns. Referncings parts of the
array (the image) is done with "slicing". I note that I can use a
colon-delimited set of numbers to specify a range in the rows or columns.
The second number, as in all python slicing, is alwasy one greater than
the actual place we wnat to stop in the specification (not intuitive at
all). Having just a ":" alone indicates we are specifiying the entive
row or column.
Return to top of page.
Read a numpy array from a file (Really easy!) and address single elements.
Here I use a really simple way to read numbers into a numpy array directly
from a local file named "test.txt". This code is named "2darray_ex2.py". The
reading text part is what is new, but I play around a little more with indexing.
#!/usr/bin/env python

import numpy as np

#=======================================================
# I read the text lines directly into a numpy array
b = np.loadtxt('test.txt', dtype=float)
print "\nHere is my loaded numpy array (named b):\n",
print b
print "Type of b         = %s \n" % ( type(b) ),
print "b.dtype = ", b.dtype
print "b.shape = ", b.shape
#=======================================================

print "Mean of b   = %8.3f \n" % ( b.mean() ),
print "Min of b    = %8.3f \n" % ( b.min() ),
print "Max of b    = %8.3f \n" % ( b.max() )

# Just print one value
rr = raw_input("Enter index of row for dispaly = ")
ix=int(rr)
rr = raw_input("Enter index of column for dispaly = ")
iy=int(rr)
print "b at this position = ", b[ix,iy]

# A neat way to get the dimensions directly in integer form
nrows, ncols = b.shape
#print type(nrows), type(ncols)
print "Shape of b = ", ( b.shape )
print "Dimensions of b (as integers) = %d %d\n" % (nrows,ncols)

numpix=0
sumf=0.0
for rowindex in range(0,nrows):
 for colindex in range(0,ncols):
   print "rowindex,colindex = ", rowindex,colindex, "  b=", b[rowindex,colindex]
   sumf = sumf + b[rowindex,colindex]
   numpix = numpix + 1

print "number of pixels, sum of values = %d %f \n" % (numpix,sumf)


% python 2darray_ex2.py

Here is my loaded numpy array (named b):
[[1.1 1.2 1.3 1.4 1.5]
 [2.1 2.2 2.3 2.4 2.5]
 [3.1 3.2 3.3 3.4 3.5]]
Type of b         =
b.dtype =  float64
b.shape =  (3, 5)
Mean of b   =    2.300
Min of b    =    1.100
Max of b    =    3.500

Enter index of row for display = 1
Enter index of column for display = 1
b at this position =  2.2
Shape of b =  (3, 5)
Dimensions of b (as integers) = 3 5

rowindex,colindex =  0 0   b= 1.1
rowindex,colindex =  0 1   b= 1.2
rowindex,colindex =  0 2   b= 1.3
rowindex,colindex =  0 3   b= 1.4
rowindex,colindex =  0 4   b= 1.5
rowindex,colindex =  1 0   b= 2.1
rowindex,colindex =  1 1   b= 2.2
rowindex,colindex =  1 2   b= 2.3
rowindex,colindex =  1 3   b= 2.4
rowindex,colindex =  1 4   b= 2.5
rowindex,colindex =  2 0   b= 3.1
rowindex,colindex =  2 1   b= 3.2
rowindex,colindex =  2 2   b= 3.3
rowindex,colindex =  2 3   b= 3.4
rowindex,colindex =  2 4   b= 3.5
number of pixels, sum of values = 15 34.500000
This took up the good part of a Saturday!
Return to top of page.
Using a FITS image as input.
I wanted to use a FITS image as the source for my numpy array, and
so I generated a simple FITS image. The
code I do this with is named "2darray_ex3.py". I show the source code and
a typical run below:
#!/usr/bin/env python

import numpy as np
from astropy.io import fits

#=======================================================
# I read the text lines directly into a numpy array
hdu_list = fits.open('a1.fits')
hdu_list.info()
any = raw_input("Enter any key to continue ")

# Now I put the image data into an array name "b"
b = hdu_list[0].data
print "\nHere is my loaded numpy array (named b):\n",
print b
print "\nb.shape = ", b.shape
any = raw_input("Enter any key to continue ")

# Here is how I get the value of a header card
naxis1 = hdu_list[0].header['NAXIS1']
print "The type of naxis1 is = ", type(naxis1)
print "naxis1 = %d \n" % (naxis1)

any= raw_input("Enter any key to continue ")
#=======================================================

print "\nHere are some simple statistics for b: \n"
print "Mean of b   = %8.3f \n" % ( b.mean() ),
print "Min of b    = %8.3f \n" % ( b.min() ),
print "Max of b    = %8.3f \n" % ( b.max() )

# Just print one value
rr = raw_input("\nEnter index of row for display = ")
ix=int(rr)
rr = raw_input("Enter index of column for display = ")
iy=int(rr)
print "\nb at this position = ", b[ix,iy]

# A neat way to get the dimensions directly in integer form
nrows, ncols = b.shape
#print type(nrows), type(ncols)
print "Shape of b = ", ( b.shape )
print "Dimensions of b (as integers) = %d %d\n" % (nrows,ncols)

numpix=0
sumf=0.0
for rowindex in range(0,nrows):
 for colindex in range(0,ncols):
   print "rowindex,colindex = ", rowindex,colindex, "  b=", b[rowindex,colindex]
   sumf = sumf + b[rowindex,colindex]
   numpix = numpix + 1

print "\nnumber of pixels, sum of values = %d %f \n" % (numpix,sumf)


Here is an example where I run the code:

% python 2darray_ex3.py
Filename: a1.fits
No.    Name      Ver    Type      Cards   Dimensions   Format
  0  PRIMARY       1 PrimaryHDU       7   (6, 5)   float32
Enter any key to continue

Here is my loaded numpy array (named b):

[[50.    80.    49.896 49.916 49.984 50.1  ]
 [50.04  80.    49.936 49.956 50.024 50.14 ]
 [50.08  80.    49.976 49.996 50.064 50.18 ]
 [50.12  80.    50.016 50.036 50.104 50.22 ]
 [50.16  49.5   50.056 50.076 50.144 50.26 ]]

b.shape =  (5, 6)
Enter any key to continue
The type of naxis1 is =
naxis1 = 6

Enter any key to continue

Here are some simple statistics for b:

Mean of b   =   54.033
Min of b    =   49.500
Max of b    =   80.000


Enter index of row for display = 4
Enter index of column for display = 1

b at this position =  49.5
Shape of b =  (5, 6)
Dimensions of b (as integers) = 5 6

rowindex,colindex =  0 0   b= 50.0
rowindex,colindex =  0 1   b= 80.0
rowindex,colindex =  0 2   b= 49.896
rowindex,colindex =  0 3   b= 49.916
rowindex,colindex =  0 4   b= 49.984
rowindex,colindex =  0 5   b= 50.1
rowindex,colindex =  1 0   b= 50.04
rowindex,colindex =  1 1   b= 80.0
rowindex,colindex =  1 2   b= 49.936
rowindex,colindex =  1 3   b= 49.956
rowindex,colindex =  1 4   b= 50.024
rowindex,colindex =  1 5   b= 50.14
rowindex,colindex =  2 0   b= 50.08
rowindex,colindex =  2 1   b= 80.0
rowindex,colindex =  2 2   b= 49.976
rowindex,colindex =  2 3   b= 49.996
rowindex,colindex =  2 4   b= 50.064
rowindex,colindex =  2 5   b= 50.18
rowindex,colindex =  3 0   b= 50.12
rowindex,colindex =  3 1   b= 80.0
rowindex,colindex =  3 2   b= 50.016
rowindex,colindex =  3 3   b= 50.036
rowindex,colindex =  3 4   b= 50.104
rowindex,colindex =  3 5   b= 50.22
rowindex,colindex =  4 0   b= 50.16
rowindex,colindex =  4 1   b= 49.5        # THIS IS OUR UNIQUE CUSTOM PIXEL VALUE!!!
rowindex,colindex =  4 2   b= 50.056
rowindex,colindex =  4 3   b= 50.076
rowindex,colindex =  4 4   b= 50.144
rowindex,colindex =  4 5   b= 50.26

number of pixels, sum of values = 30 1620.980000
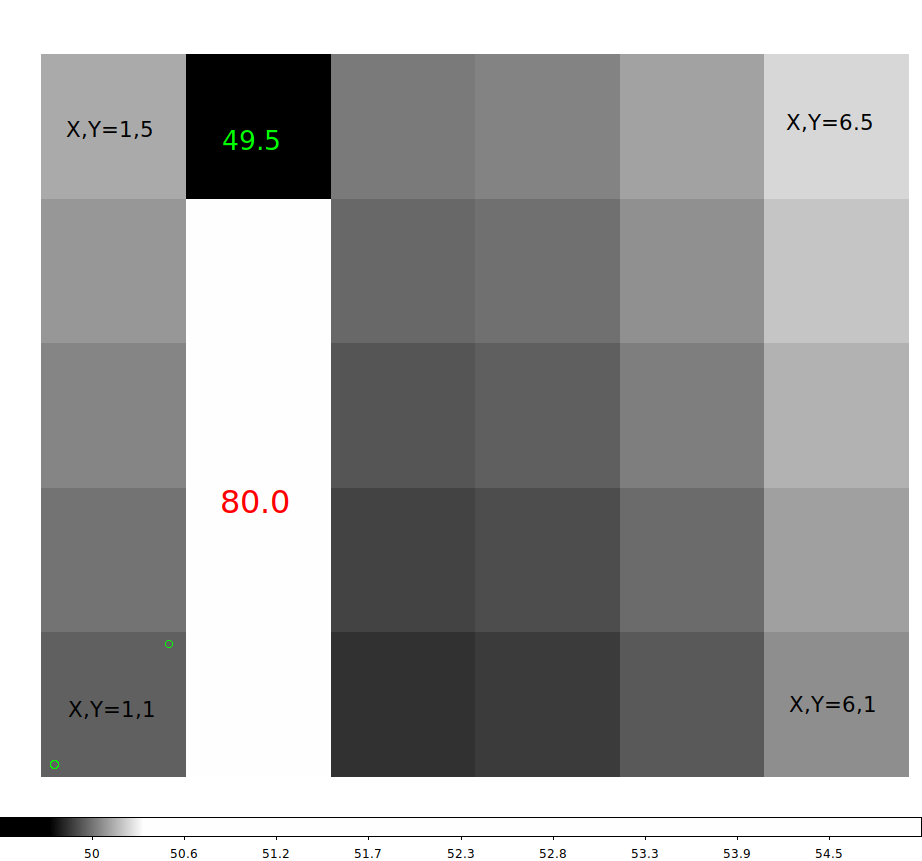
Notice that the hdu_list.info() routine does list the image dimensions
as 6x5, and that is becasue this is an astropy module. The numpy shape is
given as rows and columns and hence the shape is given as "5 6". Note also
that the indices are zero-indexed. Despite all this crap, I was able to
specify the correct row and colunm index so that I got the custom pixel
value f I=49.5 to be displayed.
Finally, notice that when I print the numpy array (b) near the top of my example
output, the image is flipped in the Y dimension compared to the ds9 example below.
This is becasue numpy (and python in general) assign X,Y=0,0 to the upper-left
corner of the image. This is a publishing convention, probably one that is older than
the astronony convention used in ds9.