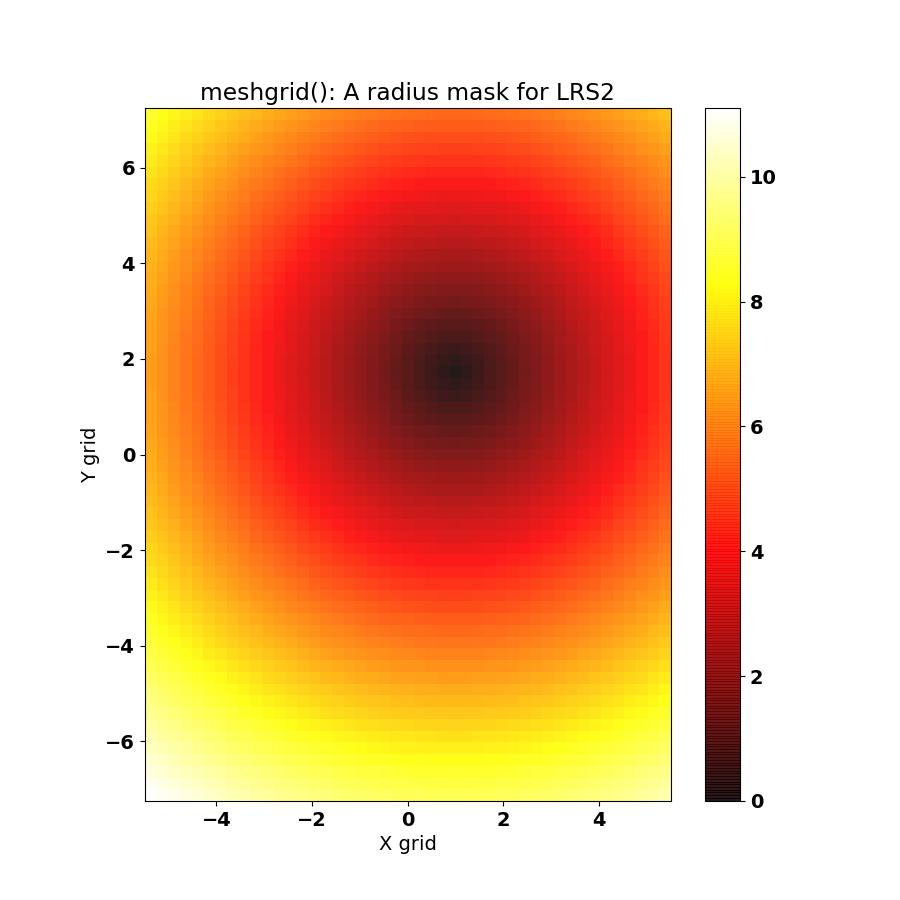
I began diescting Greg Z's python code (I call it gregz1.py) and started
playing around with the function in numpy called meshgrid. In the course of
that I learned some use ful things about plotting images in matplotlib. Below
I show the code (which does read the IZw136 cube) and the plot I
made with it. I learned how to change the center of the radius map, and
this is something I can play around with in optimmizing the estraction
of the IZw136 spectrum. Here is the code:
% cat /home/sco/NumPy/IZw136/meshgrid_lrs2.py
from astropy.io import fits
import numpy as np
import matplotlib.pyplot as plt

# I want to undestand what np.meshgrid does.

k = fits.open('eng_galaxy_1_LRS2B_cube.fits')

x = np.arange(k[0].header['NAXIS1'])*k[0].header['CDELT1'] + k[0].header['CRVAL1']
y = np.arange(k[0].header['NAXIS2'])*k[0].header['CDELT2'] + k[0].header['CRVAL2']
w = np.arange(k[0].header['NAXIS3'])*k[0].header['CDELT3'] + k[0].header['CRVAL3']
xgrid, ygrid = np.meshgrid(x, y)

# Find the limits
x1 = xgrid.min()
x2 = xgrid.max()
y1 = ygrid.min()
y2 = ygrid.max()

Xo = 1.0
Yo = 1.75

#x = np.arange(-5, 5, 0.1) + 1.0
#y = np.arange(-6, 6, 0.1) + 2.0
#xx, yy = np.meshgrid(x, y, sparse=False)
z = np.sqrt( (xgrid-Xo)**2 + (ygrid-Yo)**2 )

#=========================================================
# experimental == specify plot properties
paramso = {'savefig.format'       : 'png',
          'figure.figsize'       : [9.0, 9.0],
          'font.size'            : 14,
          'font.weight'          : 'bold',
          }
plt.rcParams.update(paramso)

#          'image.aspect'         : 'equal' }
#=========================================================

# I like to see an image better
plt.imshow(z, origin='lower',
#          cmap='hot', alpha=0.9, aspect='equal' )
           cmap='hot', alpha=0.9, aspect='equal', extent=[x1,x2,y1,y2] )

# alpha controls the transparency
# cmap values:   RdGy coolwarm seismic bwr plasma hot

plt.colorbar();

plt.title('meshgrid(): A radius mask for LRS2')
plt.xlabel( 'X grid' )
plt.ylabel( 'Y grid' )

plt.show()
The plot that I make with this code is below.