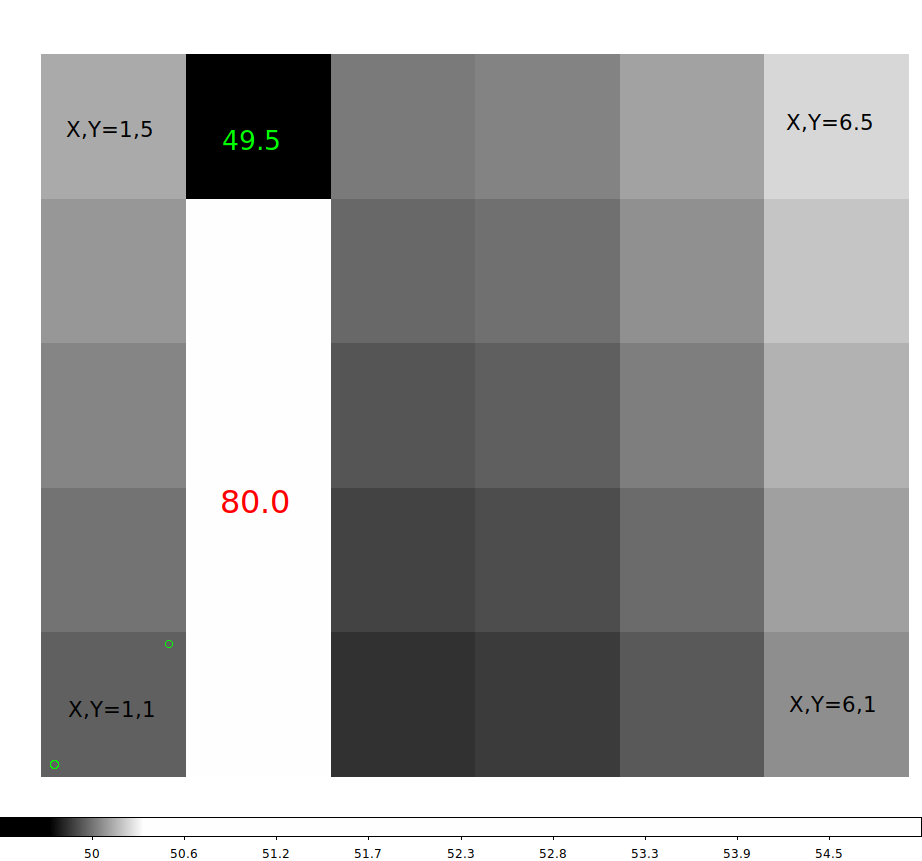
Here is a small test FITS image made for testing some early numpy codes. This
6x5 FITS image uses a 3 term polynomial to generate a backround with pixels values
around I=50.0, and a few pixels are marked with custon values (49.5 and 80.0)
using an optional input file named "pix.1". The command and files used to do this
are shown here:
% clip_build_fits.sh 6 5 poly.1 a1.fits -p pix.1
% cat poly.1
50.0
-0.5
0.2
+0.6
% cat pix.1
2 2  1 4 80.0
2 2  5 5 49.5
I have marked the pixels in column 2 (x=2) that have a value of I=80, and
the single pixel at the top of column 2 (x=2,y=5) that has a value of I=49.5.
I have also marked the corners of the X,Y values that a display gui like ds9
will show as the coordintes for these pixels. Finally, note that the center of
the pixel is where the integer pixel coordinates appear. In the lower left pixel
I show two small green circles. The lower left circle is very close to X,Y=0.5,0.5
and the pixel in the upper right is very near X,Y=1.5,1.5. This may seem like a small
point, but later when we are trying to interpret the intensity weighted centroid
position in an under-sampled image, this small detail will come back to haunt us.
|