CHEMICAL COMPOSITIONS OF HALO STARS
HOME |
TEACHING |
HALOSTARS |
DISKSTARS |
LABDATA |
MOOG |
SPECTRE |
MISC
Why Study Stellar Chemical Compositions?
|
|
|
The record of our Milky Way Galaxy's initial burst of element generation is contained in the chemical compositions of metal-poor stars of the Galactic halo. I am involved in several related efforts to apply high resolution, high S/N spectroscopy to the determination of abundances in stars with metallicities ranging over three orders of magnitude. Here I briefly discuss a few aspects of these projects, These results are products of the collective efforts of my friends who are co-authors on the various papers.
Neutron-Capture Elements: the r-Process
Neutron-capture elements are those whose major isotopes are created in nuclear fusion regions via the ingestion of free neutrons by lighter seed nuclei (such as Fe, for example). The neutron-capture elements defined in this way comprise essentially all elements of the periodic table with atomic numbers greater than 30, thus comprising nearly two-thirds of the stable elements in the periodic table. Neutron-capture and beta-decay rates compete with each other in building the neutron-capture elements. Low neutron fluxes (the so-called s-process) create unstable nuclei that undergo beta-decays between successive neutron captures, and element synthesis proceeds along the valley of beta-stability. High neutron fluxes (the r-process) create extremely heavy isotopes of nuclei (up to the neutron-drip line) that then rapidly decay back toward the valley of β-stability after the cessation of the neutron flux. The s-process occurs during quiet stellar evolution (such as during helium burning), while the very violent r-process is associated in some way with the explosive deaths of high-mass stars in Type II supernovae.
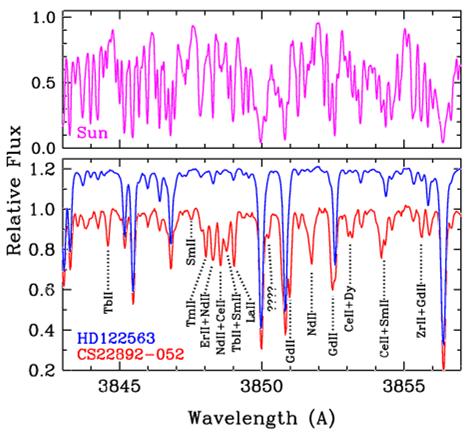
The most metal-poor of our Galaxy's stars exhibit enormous variations in their bulk contents of neutron-capture elements, as a glance at these spectra show.
|
|
|
|
Neutron-Capture Elements: the s-Process
In the Galactic halo live many "blue metal-poor" (BMP) stars. These are stars that are on the main sequence but are bluer and more luminous than the normal stars of the main-sequence turnoff. If they are as old as the rest of the Galactic halo, BMP stars should have long-since evolved away from the main sequence. George Preston discovered (2000, AJ, 120, 1014) that about 2/3 of BMP stars are spectroscopic binaries, ones with long orbital periods but very low eccentricities (that is, nearly circular orbits). The simplest conclusion is that BMP stars that we see today are past victims of substantial mass transfer from companions that now are compact objects. The mass transfer happened during the expansion of the companion envelopes during their red-giant branch (RGB) or asymptotic giant branch (AGB) phases.
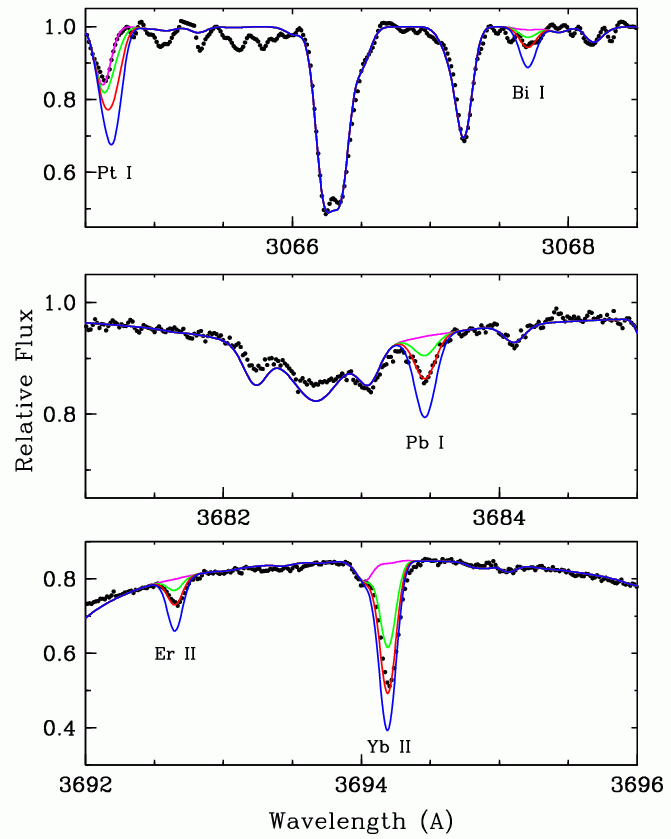
Further proof of this scenario has come from chemical composition studies of BMP stars. We discovered (Sneden, Preston, & Cowan 2003, ApJ, 592, 504) that several of the most metal-poor BMP binaries have greatly enhanced neutron-capture abundances with a distinct s-process distribution. The heaviest elements in the s-process chain, lead (PB) and bismuth (Bi) were discovered in one BMP star, as the following illustration shows.
|
|
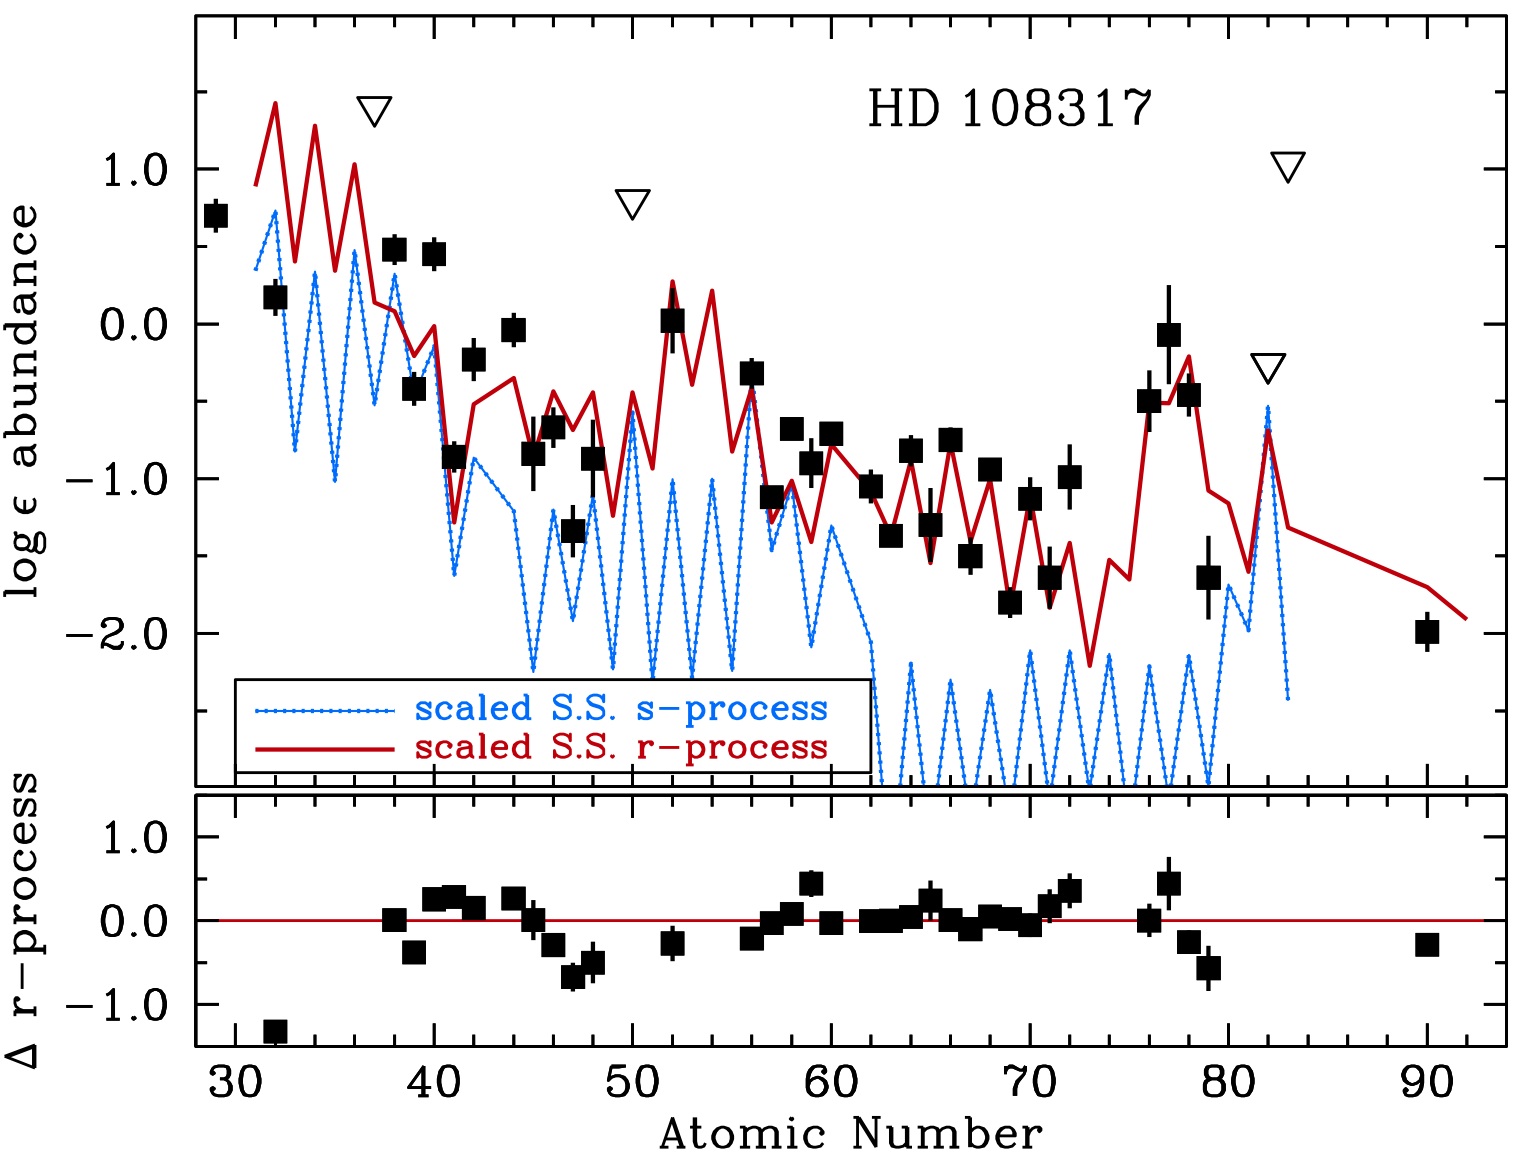
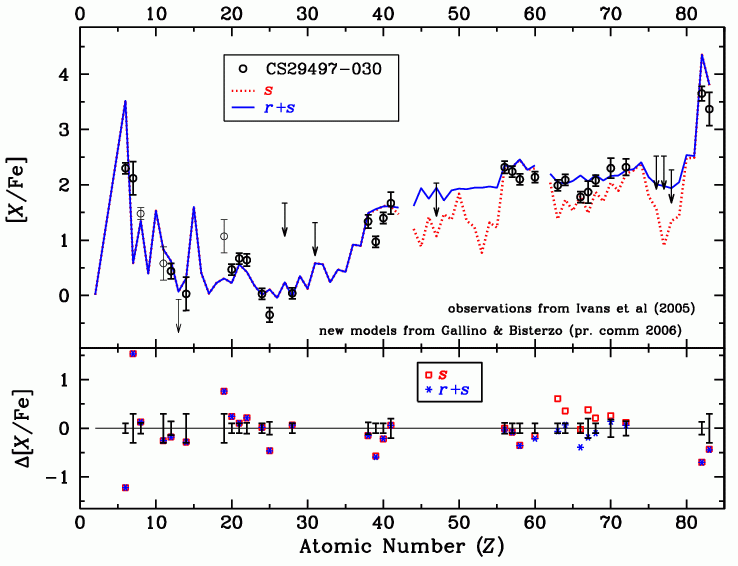
Detailed comparisions with predicted s-process abundance distributions confirm its dominance in BMP binaries, as illustrated in the nex figure.
|
|
Globular Cluster Abundances

|
|
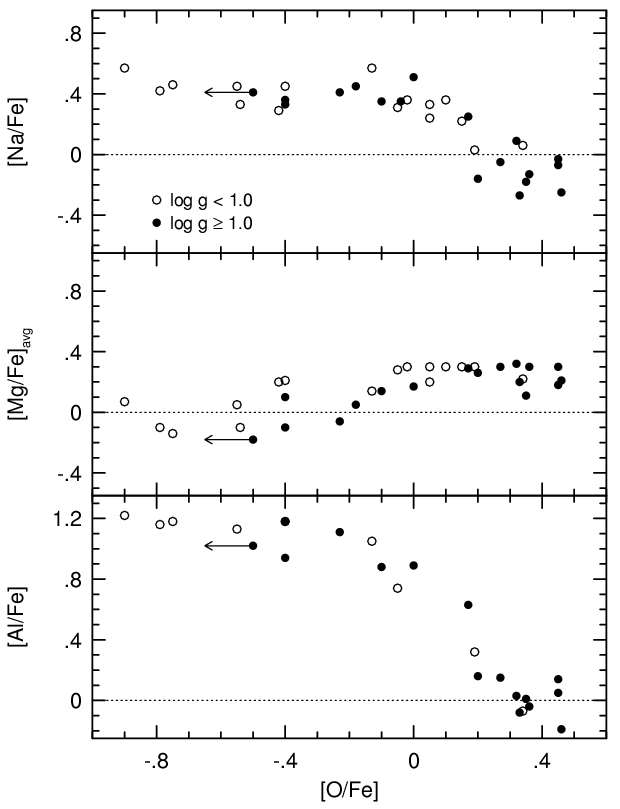
The elemental abundance patterns of globular cluster stars exhibit a rich (and often bewildering) variety. Very large star-to-star and cluster-to-cluster abundance differences are the rule, not the exception. The light elements of the periodic table (those elements with atomic numbers 13 or less) have the most obvious variations. The abundances of elements C, N, O, Na, Mg, and Al can be different in otherwise very similar giant stars of a single globular cluster. Fortunately, these abundances do not vary at random, but instead are interlinked in various correlations and anticorrelations. But some stars will have relatively large abundances of O and Mg and small abundances of Na and Al, while other stars will show the opposite abundance pattern. Good examples are the plots shown in the diagrams below.
|
|
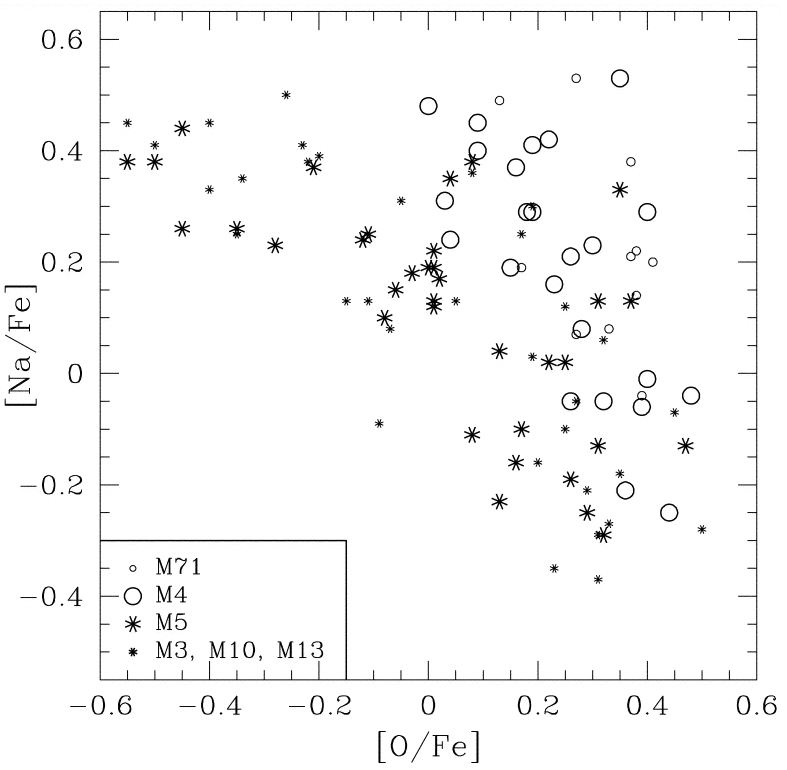
A simple nucleosynthetic scenario covers many of the observed light element variations: very high temperature (up to 80 million degrees Kelvin) hydrogen fusion cycles. At the same high interior temperatures in which O can be converted to N in the ON-cycle hydrogen burning, spectroscopically undetectable) Ne can and will be turned into Na The anticorrelation between O and Na therefore occurs quite naturally, and the difference between high O, low Na stars and low O, high Na stars is that the latter stars have had a combination of higher interior temperatures and better convective envelope mixing than have the former stars. But the high central temperatures needed to make this idea work are daunting. Recent studies focus instead on the idea that earlier generations of cluster stars (now dead) seeded the intra-cluster medium with their elemental output, and the presently observed stars gathered in this material at birth. Please see, for example, Carretta et al. (2009) and the review by Carretta et al. (2009) for an extended discussion of these issues.
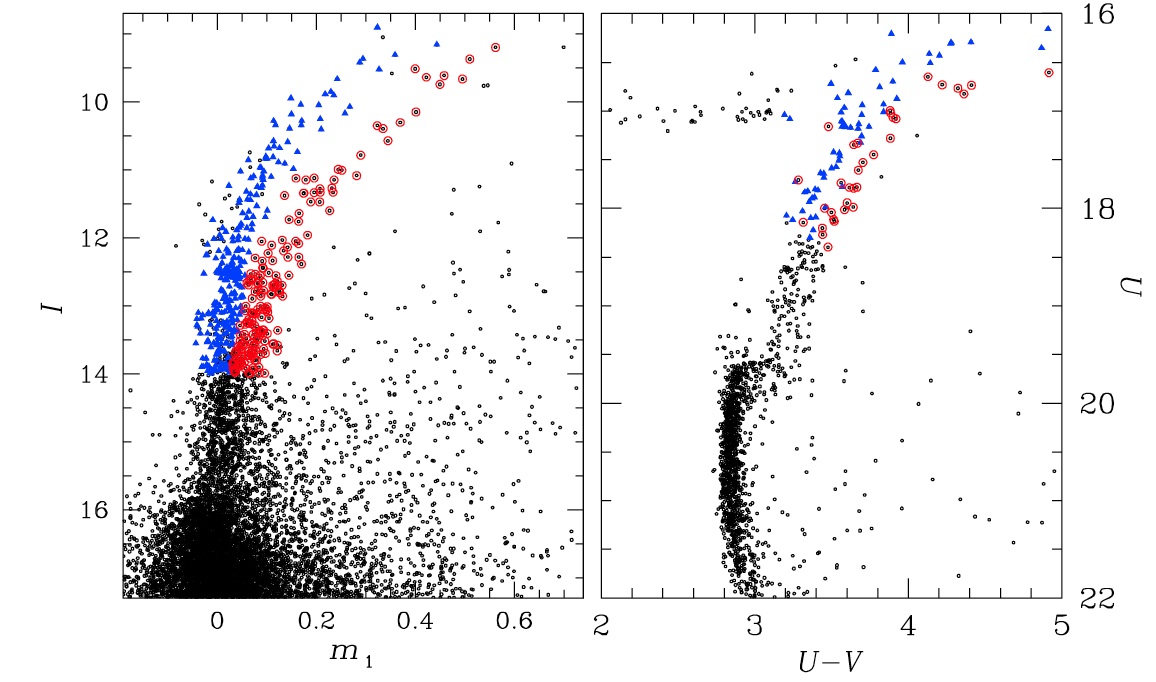
Support for the multiple-population idea has come from the identification in recent years of several globular clusters with multiple color-magnitude diagram sequences. These clearly indicate age/metallicity/abundance spreads in at least these clusters. Particularly intriguing is the case of M22. Not only is a split red giant branch (RGB) obvious in the figure below, but the discriminants in the color-magnitude diagram appear to be related to two chemically-distinct populations: a relatively metal-poor group (mean [Fe/H]=-1.82) that has neutron-capture element abundances characteristic of r-process dominance, and a less metal-poor group (mean [Fe/H]=-1.67) that exhibits of significant enhancements of carbon and s-process abundances. These results are described in detail by Marino et al. (2012) and references therein.
|
|
Acknowledgments
All of the research described here has resulted from the collective efforts of large numbers of people, including my current and former students, and investigators at many astronomical institutions around the world. Their contributions are gratefully acknowledged. For many years I have benefited from grants by the U.S. National Science Foundation and the National Aeronautics and Space Administration. Their support has been crucial to my research.