make_fit_data
Updated: Oct9,2018
Generate test data using a function in one dimension.
make_fit_data --help     # Best source of information
Usage: make_fit_data poly4 c.1 50 1.0 10.0  0.0 2.0 Y
arg1 - type of curve
arg2 - name of coefficients file
arg3 - number of points
arg4 - xmin
arg5 - xmax
arg6 - st.dev. of iX-axis noise added
arg7 - st.dev. of iY-axis noise added
arg8 - Run in debug mode (Y/N)

Note, you can get a quick listing of available finctions with:
make_fit_data L
The data are written to a file named make_fit_data.out. The analytical functions
available are provide by gen_curve.sh. Use
the "--help" option with gendata.sh to get a detailed listing of these funtions.
It should be noted that it is not necessary to prepare a coeficients file before
the make_fit_data script is run. If the file is not present then the user will
be interactivel queried for the coefiicients. A file with the name specified on
the command line (arg2) will then be created. Bleow I show some examples of
data sets generated with make_fit_data and then plotted with the suggested
pxy_SM_plot.py.
Generating a 4-term polynomial.
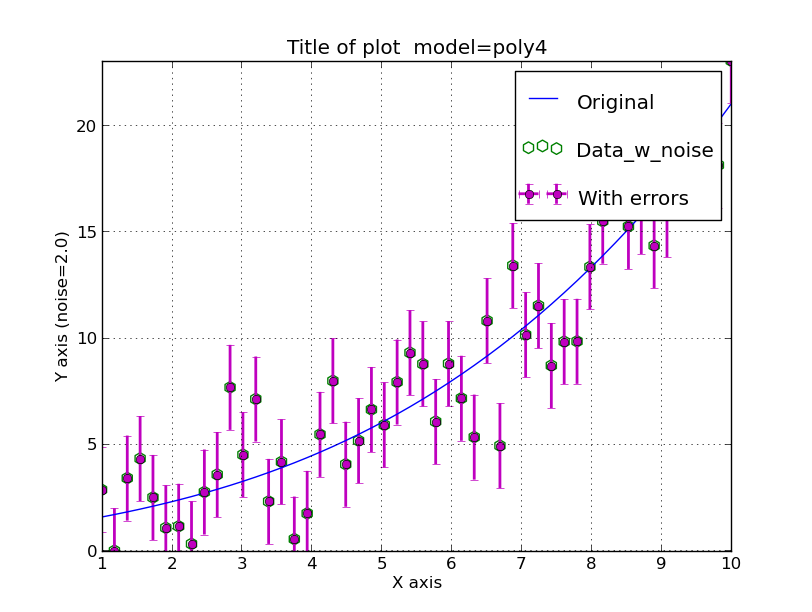 |
Data generated with make_fit_data using a 4 term polynomial with noise
added to each axis. The commands used were:
% make_fit_data poly4 c.1 50 1.0 10.0 0.0 2.0 Y

% cat c.1
 1
 0.5
 0.05
 0.01

To make the plot:
pxy_SM_plot.py STYLE 1.0 10.0 -0.02498 23.02544 SHOW
By using the show() option of matplotlib we can adjust the scaling
of the plot before generating a hardcopy file.
|
Back to SCO CODES page