- What is this exrcise?
- Using the profile and phot2 codes together.
- Image catalogs again!
What is this exrcise.
As the March and May notes in this doc describe, I spent a lot of time developing
tools to perform point source photonetry on the acm images. I had not anticipated
the PSF size variation we sometimes see in the HET acm image sets. This is probably
due to focus changes that occure in going to different targets in the sky. Hence, we
need a means of measuring and/or correcting a magnitude measurement to refer to an
aperture size that will give us a "total" flux measurement. We need this in order
to establish the proper photometric zeropint to measure sky surface brightness (SSB).
In the May2020 profile work I concentrated primarily on two images, a good focus and
a bad focus case:
Good focus (T0_good_focus):
ds9_profiles_x  /home/sco/ACM_work_Oct2019/phot2_check_3/PHOT2_local/20191018T084754.9_acm_sci.fits
Bad focus (T0_bad_focus):
ds9_profiles_x /home/sco/ACM_work_Oct2019/phot2_check_3/PHOT2_local/20191018T084633.3_acm_sci.fits

See:
ACM_work_Oct2019/red_20191018/local_red/ISET_STACKS/list.8
These are acm g images in the iset=8 set of images from Oct18,2019.
The goal of this exercise is to basically to verify that: Assuming the sky
surface brightness was constant throughout this set, taken over 102 sec between
UT=084608.9 and UT=084754.9, we should derive the same sky surface brightness
from all of the images, independent of focus state.
Below I run the two images (good and bad) through the
phot2_fitslist code to
derive the photometruc zeropoint and SSB for each image. I run them
using two separate input files (of one image each) and I run
thenm in interactive mode so that I specify everything using queries and
I inspect the final set of ZP data points to compute a final mean value.
  % cd /home/sco/ACM_work_Oct2019/red_20191018

  % cat ./S_jun03/list.good_focus
  /home/sco/ACM_work_Oct2019/phot2_check_3/PHOT2_local/20191018T084754.9_acm_sci.fits
  % phot2_fitslist ./S_jun03/list.good_focus 0.05 3 -i

  % cat ./S_jun03/list.bad_focus
   /home/sco/ACM_work_Oct2019/phot2_check_3/PHOT2_local/20191018T084633.3_acm_sci.fits
  % phot2_fitslist ./S_jun03/list.bad_focus 0.05 3 -i

  I found:

       ZeroPoint         SSB (mag per sq.arcsec)        Sky (in ADU)
     -2.650 -+0.015          19.330 -+ 0.015             473.66 -+0.04     20191018T084754.9_acm_sci.fits   (good foc)
     -2.688 -+0.024          19.297 -+ 0.010             471.06 -+0.04     20191018T084633.3_acm_sci.fits   (bad foc)
      0.038                   0.033                        2.6              Difference

 What are the resulst if I run in a noninteractive mode by creating "apphot.config":
 % cat apphot.config
% cat apphot.config
radarcsec 10.0
NumPixMin   8
Sradarc    3.0
% phot2_fitslist ./S_jun03/list.both 0.05 3

       ZeroPoint         SSB (mag per sq.arcsec)        Sky (in ADU)
     -2.685 -+0.027          19.295 -+ 0.027             473.67 -+0.04     20191018T084754.9_acm_sci.fits  (good foc)
     -2.701 -+0.010          19.284 -+ 0.010             471.06 -+0.04     20191018T084633.3_acm_sci.fits  (bad foc)
      0.016                   0.011                        2.6              Difference

--------------------------
I repaet the auto-reduction using all 14 images of iset=8

% phot2_fitslist ./S_jun03/list.8 0.05 3
% ls -1 ./local_red/PHOT2/*.fits > list.0
% install_pimag_fitslists list.0 N                 # To get PIMAG cards installed
% mv 20*fits ./local_red/PHOT2/

To make a tbel file:
% cat Data1.params
PSYSNAME
SKYSB
SKYSBERR
ZPSEC
ZPERR
NUMZP
MILLUM
PHIMOON
VSKYSB
PUPILLUM
RSTRT
PIMAG

% make_parlabs Data1
% cp Data1.parlab P.list
% fits2table list.0 P.list Data1 N

To make useful plot:
% Generic_Points N
% xyplotter_auto Data1 PIMAG ZPSEC 10 N
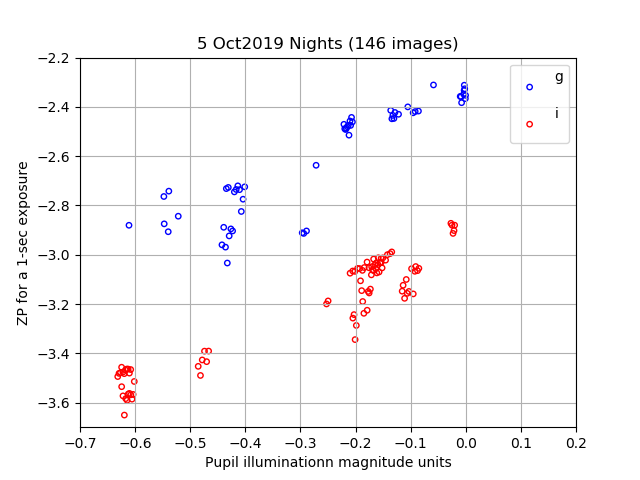
Below I combine a version of the ZPSEC vs. PIMAG plot from my May 2020 work
and the version made here. The use of an appropriately large aperture for some of the very
out-of-focus images from this set shows how we can still get go ZP (and hence SSB) agreement.
- Unless the "-v" flag is inoked in the phot2_fitslist run, the ZP table
file and apphot.config for each image will is erased.
- The phot2 routine needs an aperture size. Perhaps we could
runs profiles.sh and establish the mean R50 using all profiles
on the image. We could then use beta*R50 to establish the
aperture radius.
Return to top of page.
Using the profile and phot2 codes together.
Here is a way to use the profile and aperture photometry codes together. I use the
"out of focus" image that I have been using in several examples here. I run the
routines in a "play" reduction directory for 20191018 where I set up
Initial image:
/home/sco/ACM_work_Oct2019/phot2_check_3/PHOT2_local/20191018T084633.3_acm_sci.fits

-----------------------------------------------------------------------------------------------
Set up the "play" directory:
 cd /home/sco/play/local_red/local_red/
 cp -r /home/sco/ACM_work_Oct2019/red_20191018/local_red/Store_DSS .
 mkdir IMAGE_CATS/
 cp -r /home/sco/ACM_work_Oct2019/red_20191018/local_red/IMAGE_CATS/20191018T084633.3_acm_sci IMAGE_CATS/
 ls IMAGE_CATS/

20191018T084633.3_acm_sci/
-----------------------------------------------------------------------------------------------

*** I want to measure profiles out to radius=40pix using stars in the
    image catalog that have at least 7 connected pixels.
% reg_from_imgcat /home/sco/ACM_work_Oct2019/phot2_check_3/PHOT2_local/20191018T084633.3_acm_sci.fits -n 7 -far 40.0

% ls
20191018T084633.3_acm_sci_apertures.cdfp      20191018T084633.3_acm_sci.cdfp	  local_red/
20191018T084633.3_acm_sci_apertures.cdfp.reg  20191018T084633.3_acm_sci.cdfp.reg

The aperture catalog is in:  20191018T084633.3_acm_sci_apertures.cdfp

**** This next step is important, becasue the fullpath image, in this case, has a good WCS!

I grab a local copy, and copy the aperture reg file to a corresponding name:
% mli_copy /home/sco/ACM_work_Oct2019/phot2_check_3/PHOT2_local/20191018T084633.3_acm_sci.fits
% cp 20191018T084633.3_acm_sci_apertures.cdfp.reg 20191018T084633.3_acm_sci.reg
% ls
20191018T084633.3_acm_sci_apertures.cdfp      20191018T084633.3_acm_sci.cdfp.reg  just_fitsname.output
20191018T084633.3_acm_sci_apertures.cdfp.reg  20191018T084633.3_acm_sci.fits	  local_red/
20191018T084633.3_acm_sci.cdfp		      20191018T084633.3_acm_sci.reg	  subdir.path

To view the image and apertures:
% ds9_open 1000 800
% ds9_view  20191018T084633.3_acm_sci.fits zscale n 1

or

% ds9_imstats 20191018T084633.3_acm_sci.fitsi N      # see apertures.png in the Figure below

To measure the profiles:
% profiles_prep 20191018T084633.3_acm_sci.fits
% profiles.sh 20191018T084633.3_acm_sci.fits           # This creates  profiles.

To derive the mean R50 stats:
% table_stats.sh profiles R50d none N
      8.437572       8.460000       0.049665       0.018772       8.375000       8.508000        7    (mean,median,sigma,m.e.,min,max,N)

***** Yes! This is very close to the value I derived in earlier analyses.

So, based on this I would use an aperture radius of   R = 3 * 8.4 = 25 pixels
**** Since ps=0.271"/px    In arcsec this radius would be:   radarcsec = 6.77"

I could do the aperture photometry and get a new calibration:

I build an apphot.config file:
% cat apphot.config
radarcsec  6.77
NumPixMin  7
Sradarc    3.0

% cat list.1
20191018T084633.3_acm_sci.fits

To run this image, and insure that I have at least 3 calibrating sources
and a ZP m.e. of less than 0.05 I do:
% phot2_fitslist list.1 0.05 3

NOTE: It is phot2_fitslist that requiree the image with a good WCS, becasue this code cross-matched the
      the acm image (via WCS) to the gri data (PS1) to derive the ZP.

% ls
apertures.png  apphot.config  fort.57  list.1  local_red/  profiles.params  profiles.parlab  profiles.table

% ls local_red/
IMAGE_CATS/  PHOT2/  Store_DSS/

% ls  local_red/PHOT2/
20191018T084633.3_acm_sci.fits

% imhead ./local_red/PHOT2/20191018T084633.3_acm_sci.fits
ZPSEC   =              -2.7645 / ZP for a 1-sec exposure
ZPERR   =               0.0134 / mean error of ZPSEC
NUMZP   =                    6 / number of calbrating sources
PSYSNAME=                    g / name of photometric system
SKYMEAN =            471.06284 / mean sky in adu (skymap2)
SKYME   =              0.04080 / error of mean sky in adu
SKYSIG  =             31.00601 / sigma about mean sky in adu
SKYSB   =              19.2210 / sky surface brightness (mags per sq.arcsec)
SKYSBERR=               0.0130 / mean error of SKYSB
NUMBOX  =                    7 / number of sky boxes measured
RSTRT   =           -1252.0336 / Radius position of tracker at start (mm)
MILLUM  =             84.1000 / percentage moon illumination
PHIMOON =             48.1138 / angle of separation to moon (deg)
VSKYSB  =             18.8870 / predicted V sky surface brightness
PIMAG   =              -0.4327 / pupil illumination in magnitudes

Note that the  phot2_fitslist handles file preparation, error checking,
and final transfer to the ./local_red/PHOT2 subdirectory. It is much
easier to run this even with a single image.
 |
|
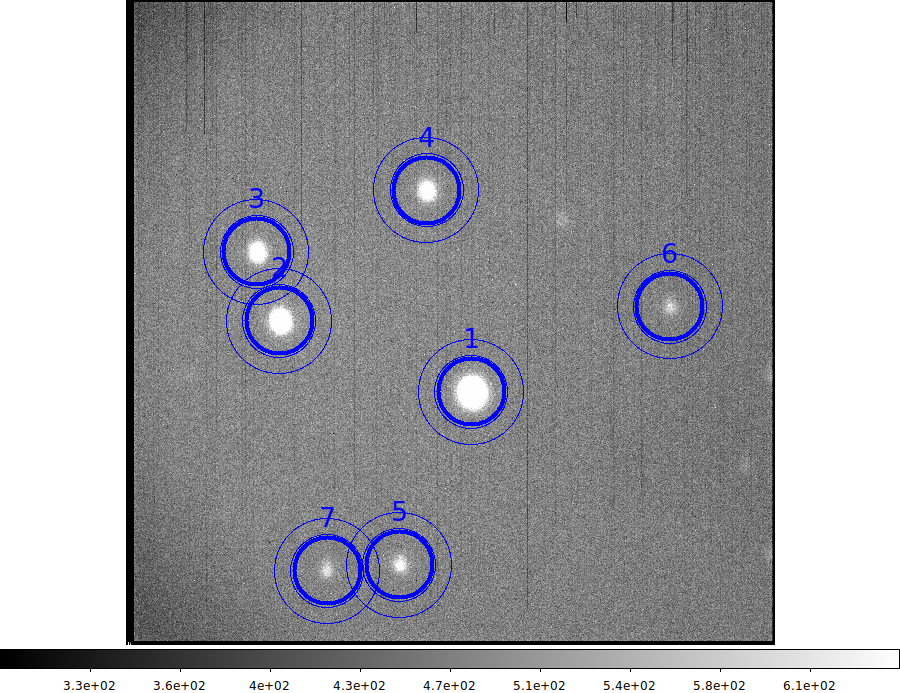
The apertures determined by running profiles.sh on a set of stars selected from
an image_catalogs source list. The thick blue circles represent the rad=6.77"
apertures, and the thing blue circles show the background determination annuli.
|
The thing to note in the above example is that my final step,
phot2_fitslist, requires an image that already has a
WCS installed in the header. This is becasue in performed the positional cross-matching to
get a phptpmetric zeropoint and then a calibrated sky surface brightness. However, the last
month has shown me that a lot of these are impotant things for this that can be carried
out prior to wcs derivation:
- profile information taht measures the mean width of the PSF
- good aperture magnitudes derived in optimal apertures
- mags corrected to "total" using a mean growth curve
- a mean sky level (in adu) derived after contributions by dicrete sources is removed
- some measure of "stellarity"
In fact, if we know some of these listed properties, we might considerably improve
our derivation of the WCS. Hence, I'll digress once again (breifly!) to experiment with
a new version of image_catalogs, where I
add these properties to the image catalog.
Return to top of page.
Image catalogs again.
Holy shit.
An acm image:
/home/sco/ACM_work_Oct2019/phot2_check_3/PHOT2_local/20191018T084633.3_acm_sci.fits

In a discussion of gathering calibration data I had another set of images that we could use:
% cp /home/sco/AUTO_match_for_wcs/S/list.0_sco2019 list.0
% cat list.0
/home/sco/AUTO_match_for_wcs/S/Rsco2043.fits
/home/sco/AUTO_match_for_wcs/S/Rsco3226.fits
/home/sco/AUTO_match_for_wcs/S/Rsco5261.fits
/home/sco/AUTO_match_for_wcs/S/20191018T024545.3_acm_sci.fits

I just stick everything into one file (list.1) and run the present image_catalogs:
% image_catalogs list.1 none N N

This takes about 40 seconds to run. I find a lot of sources on some
of these images (3 of them are PFC):
% cat ImgCats.parlab
nobs      Number sources detected by threshold
skmean    Mean signal in background map (bkg1)
sksig     StanDev in background map (bkg1)
% cat ImgCats.table
# data
 134 471.6181 8.2064
 3379 819.7111 23.8384
 2995 1144.8826 12.7368
 14401 764.1671 13.5382
 182 148.8026 2.8722

I could also look at parameter spaces:
% ls ./local_red/IMAGE_CATS/Rsco2043/
Rsco2043_BGboxes.reg  Rsco2043.cat0	    Rsco2043.fits	  Rsco2043.params  Rsco2043.props	Rsco2043.table
Rsco2043_bkg1.fits    Rsco2043_detsig.fits  Rsco2043_label0.fits  Rsco2043.parlab  Rsco2043_sigma.fits

% Generic_Points N
% xyplotter_auto ./local_red/IMAGE_CATS/Rsco2043/Rsco2043 q q 10 N

To see some apertures:
% reg_from_imgcat /home/sco/AUTO_match_for_wcs/S/Rsco2043.fits  -n 10 -far 12.0
*** Use regions file = Rsco2043_apertures.cdfp.reg
% ds9_imstats /home/sco/AUTO_match_for_wcs/S/Rsco2043.fitsa
% cat Rsco2043_apertures.cdfp.reg | xpaset ds9 regions -format ds9

Actually, there are two region files:

   Rsco2043.cdfp.reg
     All sources on the image, with the circle size scaled to the number of
     pixels in each detected image.

   Rsco2043_apertures.cdfp.reg
     A circle with radius=12 pixels for every detected source that had at
     least 10 pixels.
The question is then: can I do a profile analysis of these images and derive
a mean half-light radius , or things like that, to add to the simple ImgCats
table. Maybe I could perform aperture photometry.
 |
|
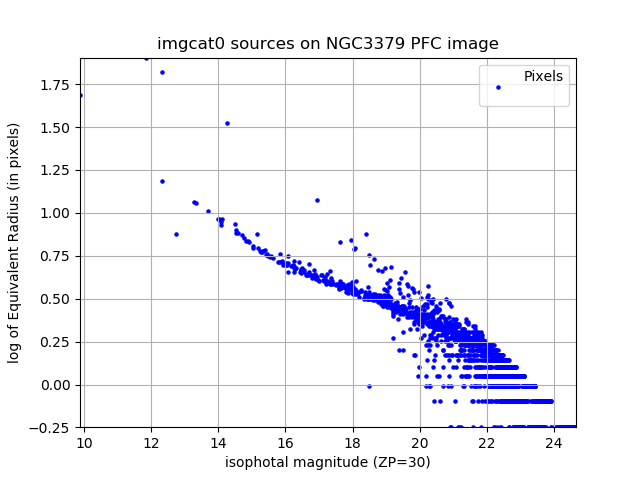
The sources found with image_catalogs on a PFC image of the NGC3379 field.
We can clearly see the stellar locus resolved down to an uncalibrated isophotal
magnitude of 20.
|
 |
|
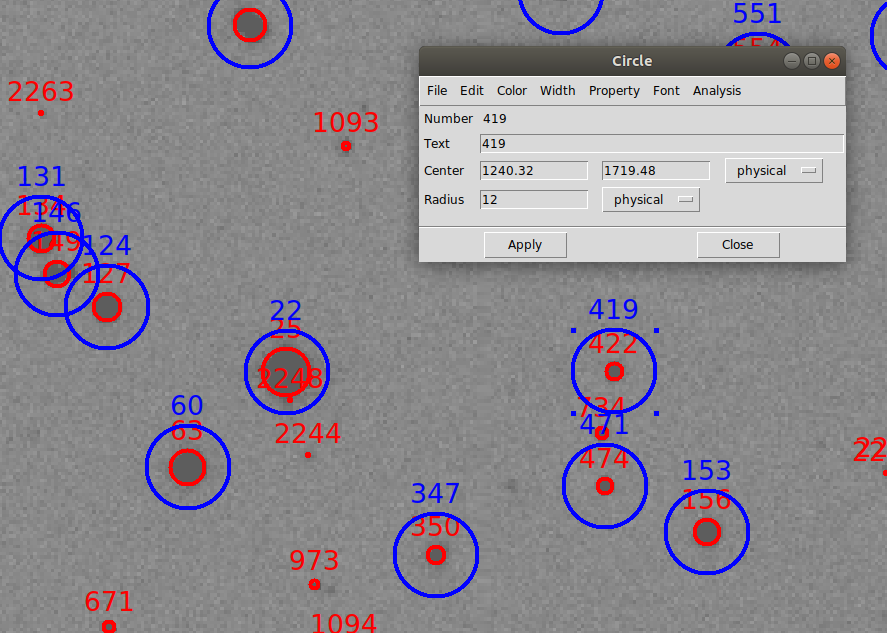
The red circles are from the file Rsco2043.cdfp.reg and have raddi scaled
to match the equivalent radius dependining on the number of detected source
pixels. The blur circles are from Rsco2043_apertures.cdfp.reg and are the
apertures specified with the call to reg_from_imgcat.
|
Back to calling page