acm bias properties
Last updated: Sep13,2019
A Sep2019 study of mean acm bias levels.
The acm image data suffer many problems. Poor or incorrect
header information, variable bias and dark signal, and a number of other annoying
trends make a direct approach to reduction impossible. A set of routines that are
specifically built for efficient acm processing were eventually developed.
One of the most fundamental problems encountered in acm image analysis is the variable
nature of the bias level. Using the early fits_review analyses I constructed the figures
below that demonstrate this problem.
 |
|
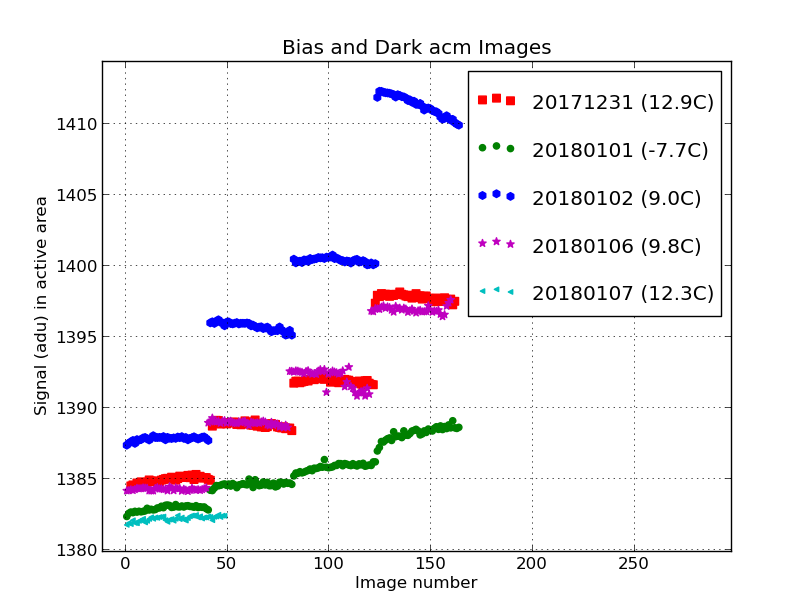
The bias and dark frame signals found in different nights of acm image data. Initially I
thought these values may have a strong temperature dpendence. However, looking at the
temperature values given in the legend we see that this is not strictly true. In this
plot I have the BIAS images hving the lowest images numbers and then I include dark
images with progressively longer integrations times of 5sec, 10sec, and 20sec.
|
I made a zoomed in version of the above figure to give the reader a clearer
view of the bias variation we encounter among different nights.
 |
|
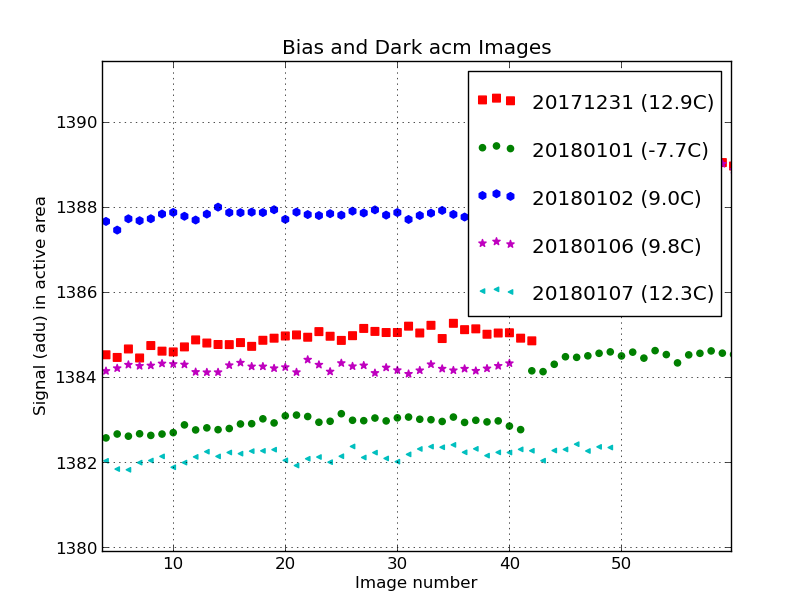
The bias and dark frame signals found in different nights of acm image data. I
have zoomed in on the bias images to show that for five different nights we
encounter bias levels that range from 1382 adu to 1388 adu. Initially I had hoped
this scatter over 6 adu would be explained by temperature vaiation, but this is not
true. The two lowest values come from the coldest (20180101,green) and one of
the warmest (20180107,cyan) nights. The lesson here is that we'll
need at least a few acm bias frames per night if we are to properly correct for the
mean bias level in acm images from a given night.
|
There has been talk of developing a bais overscan for the acm camera, but this
is in the "when pigs fly" regime.
Below I show two figures that demonstrate what we have done. The first (directly below)
show aspects of the master bias and it's application.
 |
|
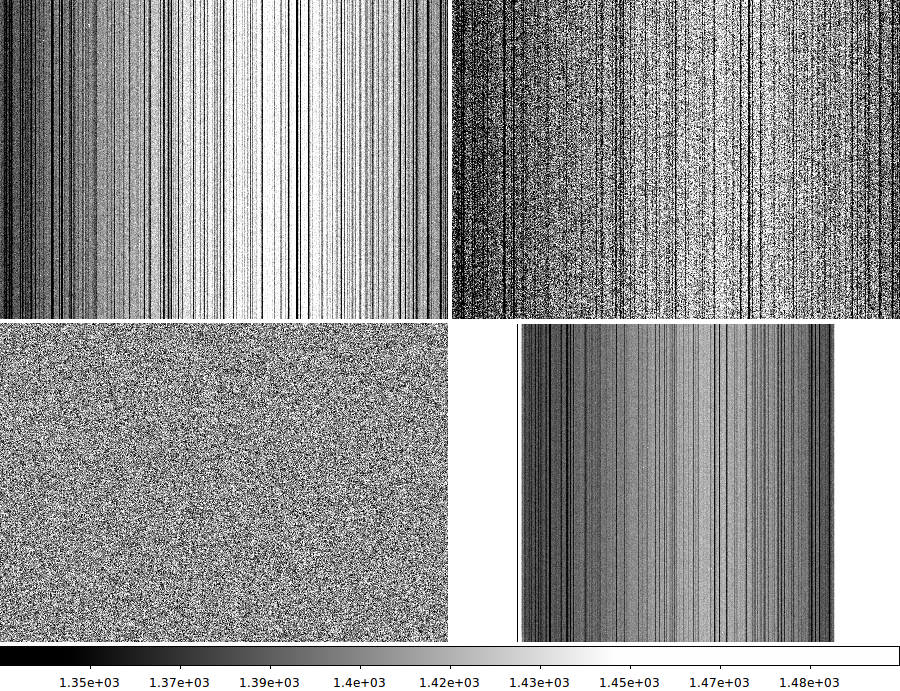
A section of the mean bias frame (a total of 21 acm bias frames) is shown in the
upper left. We see numerous vertical lines. In the upper-right is a single bias frame
of the same area (not included in the mean image stack). In the lower-left is the
same area of the single bias frame after subtracting the master mean bias. We see
a substantial improvement with regards to removing the fixed bias structure. Fianlly,
it the lower-right I show the full field image of the master bias frame to show the
large amount of bias structure in an acm image.
|
In our second figure I show how we can use the table file to build a plot that
shows the fixed bias pattern from our master stack using the
xyplotter_auto routine.
 |
|
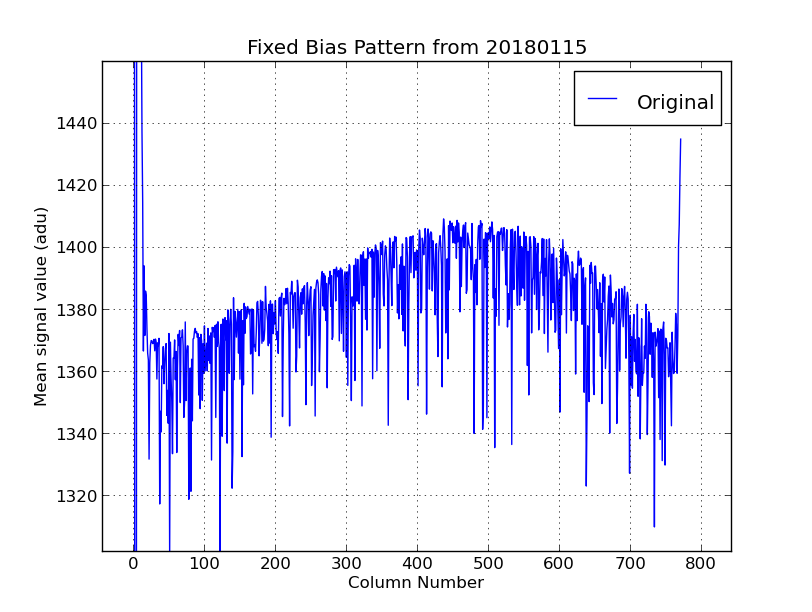
The fixed bias pattern computed with the process_acm_bias routine. Using the
matplotlib show() routine I have set the scale so that we can clearly see the
large scale properties of the acm fixed bias pattern. Despite the low resoltion
of this plot many of the bad columns in an acm bias are evident. The placement
and depth of these bad columns has remained fairly constant over the course of weeks.
Another major feature is the large-scale rise and drop in the bias signal across
the chip. The ammplitude of this feature is approximately 40 adu and hence is
extremely significant given that our average sky signals typically fall in the
range of a 50 to 300 adu. Furthermore, over a range of just 100 pixels (in the X
direction) the bias signal changes systematically by 10 adu or so (over much of
the image). Hence, without removing this source of systematic error, measurements
of profiles, sky surface brightness, or integrated magnitudes can be adversely affected.
|
In Feb2019 I reduced 4 nights in order to study the stability of the FBP.
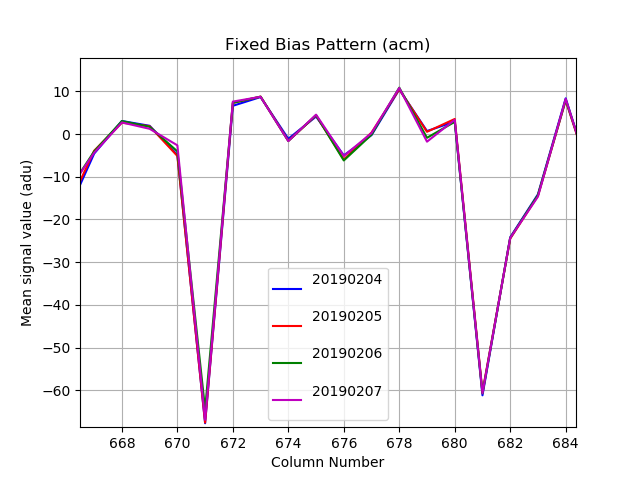 |
I have reduced 4 nights-worth of acm images. All nights had about >=25 bias
frames each (except 20190204, which has only n=5). Attached is a very zoomed
in portion of the mean fixed bias pattern for each
night showing two fairly bad columns (by no means the worst). As you can see,
the agreement between nights is extremely good. I'll be processing more nights
(in order to nail the dark count rate), but these 4 nights would seem to indicate
that the fixed bias pattern (FBP) is pretty darn stable. The mean bias over
the full image does vary by night (see column 2 below):
  Date    MeanBias  Nbias
20190204  1381.24     5
20190205  1378.69    32
20190206  1379.49    28
20190207  1381.25    25
|
On Feb14,2019 I took bias frames during Ops with the dome lights on, and then with
the dome lights off. To my surprise, the mean bias levels were
extremely close. I guess that FCU head really blocks light well. I don't think
stray light leaking through the shutter late in the day will pose any significant
problem.
Below are some Feb2019 notes that I will refine.
From:  /home/sco/ACM_BIAS_STUDY/S/README.acm_quick_table

 ************** Brief recipe listing **************
  % cd /home/sco/ACM_BIAS_STUDY/reds/20190204
  % acm_table_qc
  % mkdir bias
  % cd bias
  % cp ../list.BIAS .
  % cp ../Date .
  % process_acm_bias list.BIAS 5 def N
   # get values from *.MeanBias
  % cp fbp.* ..
  % cd ..
  % image_process_list FIXUP list.IMAGES N
  % acm_process.sh LIST.IN LIST.OUT 1381.2377  N
  % ../test1.sh

  Date     MeanBias   Nbias     Test1(mean,m.e.,sigma)
                               -------------------------
20190204  1381.2377     5      -0.0005  0.0204  9.1919
20190205  1378.6913    32       0.0166  0.0083  3.7505
20190206  1379.4875    28       0.0101  0.0085  3.8496
20190207  1381.2539    25       0.0121  0.0090  4.0757

To make a plot:
% cd /home/sco/ACM_BIAS_STUDY/reds/fbp_study1
% cp ../2019*/bias/*parlab .
% cp ../2019*/bias/*table .
% Generic_Points N
% xyplotter_auto 20190204T002627.7_acm_sci_fbp_20190204 col mean 20 N
*** I edit List.20 to add other 3 dates
% xyplotter List.20 Axes.20 N
In Marc2019 I compiled acm bias estimates from 20 nights of data. The
values are summarized in the figure below.
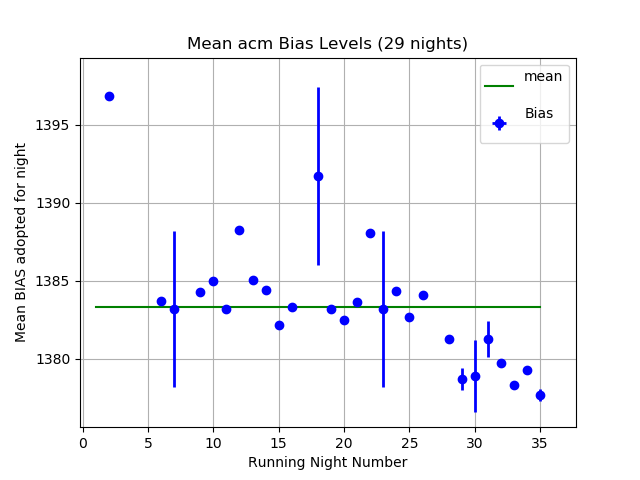 |
Mean bias estimates from acm images taken on 28 different nights covering a date
range from 20170906 to 20190219. The 1-sigma error bars on the bais values were
computed the bias image stes available on each night. The statistics for these 28
nights are given below:
BIAS statistcisc from 28 nights of acm images
Computed with:
  table_column_pull BigRed bias N BIAS.VALUES N
  calstats.py -v BIAS.VALUES

    Mean                     = 1383.50514
    Median                   = 1383.20000
    Standard deviation       = 4.00319
    Minimum                  = 1377.69150
    Maximum                  = 1396.87810
    Number of values         = 28
    Mean error of then mean  = 0.77041
Hence, a reasonable mean bias error is 1383.3 -+5.0 and this has been adopted
for use with nights where no bias images were taken. The exact value of "5.0"
will be used to indicate that this is and adopted mean value for the bias
correction. The image numbers are used on the X axis since the dates of the
nights with bias data vary a lot.
|
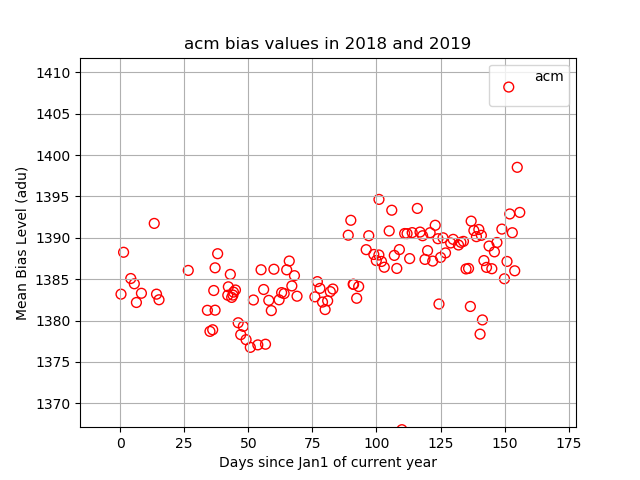
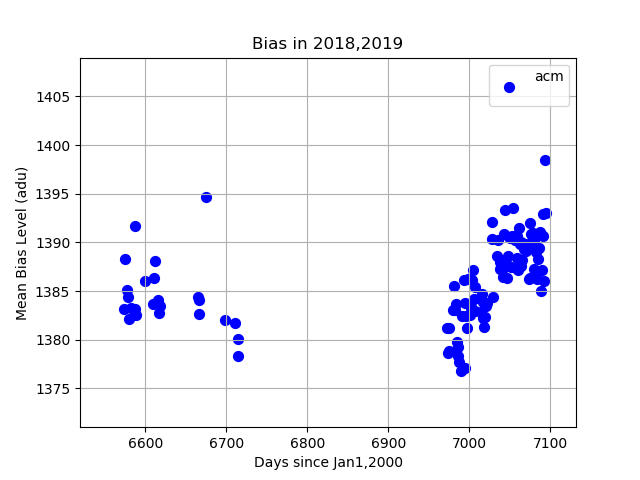
Bias over time
In June2019 I began working on all bias frames from
I did thiswith bias_by_dates on mcs:   /home/mcs/sco/BIAS_WORK_mcs_2/RUN1
The dates ran from:   20180101  to 20190605

Unfortunately there was big gap when the acm frame properties were changed, so
really these imagess come in two time groups:
   Group 1    20180101 - 20180522       Jan01,2018 to May22,2018
   Group 2    20190204 - 20190605       Feb04,2019 to June05,2019

The date when AMBTEMP first appear in headers (fro these bias sets):   20190204
Hence we only have temperature data for Grouo2 (the 2019 data).
 |
|
The mean bias levels for the 2018 (Group1) and 2019 (Group 2) data sests plotted
as a function of times since Jan1 (for each year). Here we see a correlation with time.
However, as shown below, the trens with time in 2018 and 2019 are different.
|
 |
|
The mean bias levels for the 2018 (Group1) and 2019 (Group 2) data sests plotted
as a function of time since Jan1,2000. Here we see the Group 1 (2018) data have
a decrease in bias level with time, and the Group 2 (2019) data have an increase
in bias level with time.
|
 |
|
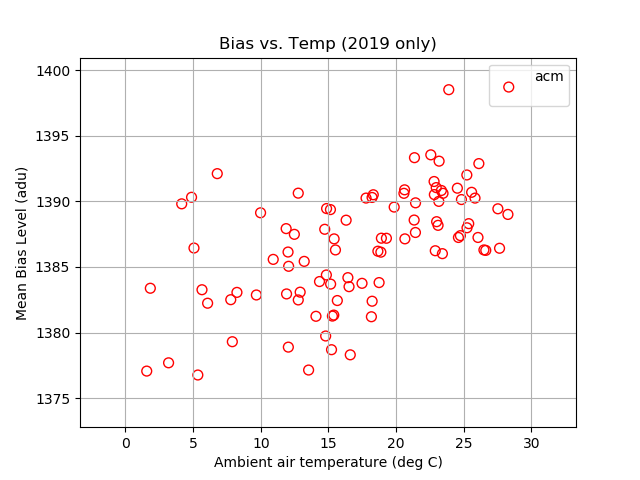
The mean bias levels for 2019 (Group 2) data sests plotted versus ambient temperature.
This could indicate a causal connection with temperature, however we only have temperature
data for the Group2 data. The correlation with time in the previous plot may be driving
this correlation. Hence, there is no firm evidence yet that ambient temperature has any
causal connection to obsevred mean bias level.
|
Back to calling page