A Sep2019 study of mean bias levels in acm images
Last updated: Sep13,2019

In Sep2019 I revised the bias assembly software modules and analyzed the nights with acm bias frames from 2018 and 2019.

 
The raw acm image reside on /hetdata/data (BaseDir) 
I ran the data assembly steps on mcs:
/home/mcs/sco/ACM_BIAS_STUDY/Sep11_2019_2019/      # 2019 data sets (Jan-Sep)) 
/home/mcs/sco/ACM_BIAS_STUDY/Sep11_2019_2018/      # 2018 data sets (Jan-May) 
/home/mcs/sco/ACM_BIAS_STUDY/Sep11_2019_2017/      # 2017 data sets (4 Dec nights) 

[sco@mcs S]$ cat BaseDir 
/hetdata/data
list.1 = file listing the 2019 nights on /hetdata/data 
To run:
% acm_bias_for_datelist list.1 N  
This took about 2 hours to run. I collect the data nto a table file format in 
/home/mcs/sco/ACM_BIAS_STUDY/Sep11_2019_2019/Plot_Set_1
To plot the data, I have assembled the plot files:   List.1, Axes.1, etc.....
% xyplotter List.1 Axes.1 N   
I move the table files assembled in this way to 
$scohtm/scocodes/Night_of_acm/BIAS/Sep2019/work1

In each pmcs processing directory (Sep11_2019_20??) we have the bias_ subdirectories for nights where bias frame were available. I gather the BIAS_DATA_2 files into sngle table files and make various plots in the work1/Plot_Set_20??_1 subdirectories. Finally, 
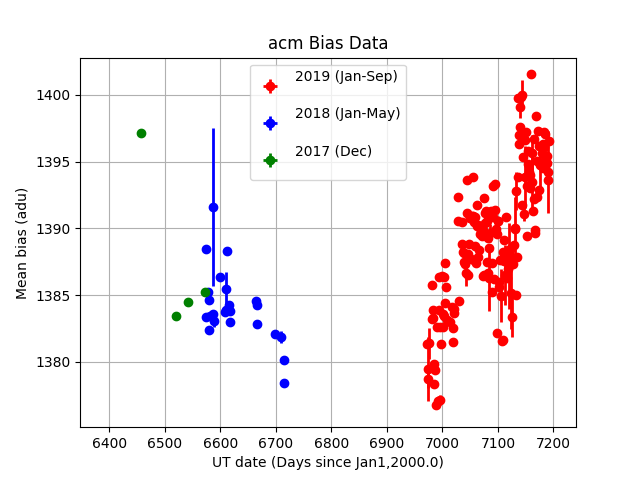
I combined the the three table files (for the 3 years) I made color-coded (by year) plots of various properties from the mean bias frames. The directories are organized as shown below and a simple summary figure follows.
 
$scohtm/scocodes/Night_of_acm/BIAS/Sep2019/work1
% ls
Plot_all_1/  Plot_Set_2017_1/  Plot_Set_2018_1/  Plot_Set_2019_1/  README

% ls *
Plot_all_1:
Axes.1	B2017.parlab  B2017.table  B2018.parlab  B2018.table  B2019.parlab  B2019.table  Bias_all_1.png  List.1

Plot_Set_2017_1:
Axes.1	B2017.parlab  B2017.table  GRAB  List.1  S/  xyplotter_auto.pars

Plot_Set_2018_1:
Axes.1	B2018.parlab  B2018.table  GRAB  List.1  S/  xyplotter_auto.pars

Plot_Set_2019_1:
Axes.1	Axes.2	B2019.parlab  B2019.table  GRAB  List.1  List.2  P1_UTdays.png	S/  s0/  xyplotter_auto.pars


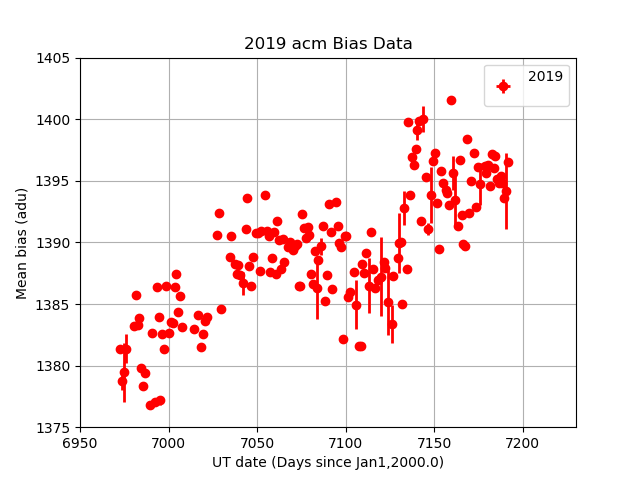
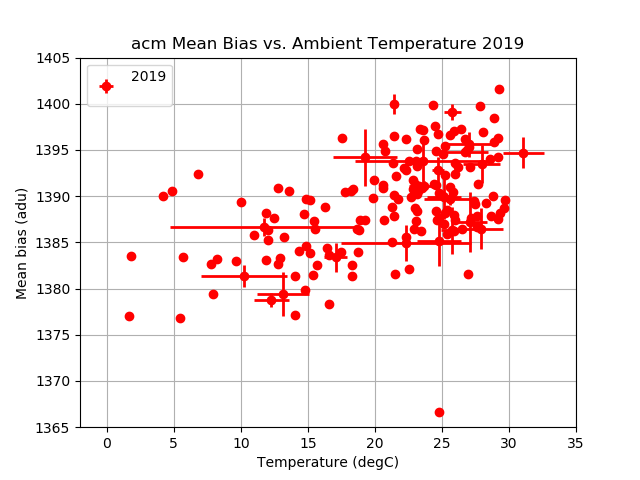
Regular gathering of acm bias frames during RA Operation Engineering seesion was begun in early 2019. At that time (Feb2019) it seems that the values of Ambient Temperature (header card = "AMBTEM") were being recorded and hence we could track both the mean bias level of the acm as well as the temperature in the dome at the time the bias frames were gatherd. The results are summarized in the figures below.


The mean bias levels of acm bias frames gathered between Feb2019 and Sep2019. We see a general upward trend with a statistically significant dip. The time values are in units of days sinve Jan1,2000 UT and hence the following table of times and dates for significant areas of the plot is helpful:
 
 
  6976 (start)         20190204, Feb2019    
  7064 (central max)   20190506, May2019 
  7119 (central min)   20190701, Jul2019 (FPA takedown)  
  7191 (last dates)    20190910, Sep10
 
We see that the bias was incraesing between Feb and May (when temp was climbing) and decreasing between May and Jul (when temperatures were presumably still climbing). In Jul2019 we had an FPA takedown, and the mean bias seemed to jump to a fairly steady level of 1395 ADU, where it remains now (Sep2019). It is unclear whether this trend is connected in a causal fashion to the temperature trend seen in the foloowing figure.


The mean bias levels of acm bias frames as a function of ambient temperature for bias frames gathered in 2019 (see above) There appears to be a trend in bias level with temperature such that lower ambient temperature produces a lower mean bias level. At low temps (Feb2019) of 10degC or less we have levels near 1382 ADU, and at high temperature (Sep2019) of 26degC or more we have levels near 1395 ADU. This systematic difference of 13 ADU is a significat copmared to the usual g-band sky level of about 40 ADU in a typical 6sec acm images. Hence, obtaining a nightly measure of the acm bias level is critical to deriving calibrated night sky surface brightness levels. When we inspect bias trends over two winter periods (see the next figure) it is unclear with this temperature trend is causal with respect to mean bias level.


The mean bias level compiled with the acm_bias_for_datelist code. Here we can see that in the Jan-May 2019 data, when temperatures were increasing with time, the mean bias level was systematical decreasing. In the Jan-Sep 2019 period, when temperatures were again increasing with time, the mean bias level was systematically increasing. Note that trends in bias with temperature appear to be opposite one another for the late2017-208 period and the 2019 period.


Back to calling page