Example 2: Using error bars in a multi-plot
You can use the link here to grab the Ex2 tar file.
After you have downloaded the tar file:
% cp ~sco/Downloads/Ex2.tar . # Use whatever path you need.
% tar xvf Ex2.tar
% cd Ex2
% cp S/* .
% ls
% ls
Axes.10 List.10 prof001.params prof001.parlab prof001.table
% cat prof001.parlab
Rmean Mean radius of pixel in annulus (pixels)
Rme Mean radius error (pixels)
flux1 Mean flux (above sky, in adu per pixel)
flux2 Median flux (above sky, in adu per pixel)
fme flux mean error (adu per pixel)
k Cummulative percentage of total flux (k)
Npix number of pixels in profile annulus
mag30 mag (ZP=20) within aperture
% cat prof001.table
# data
0.24 0.00 769.29047 769.29047 0.00000 0.0126 1 22.785
1.10 0.09 723.69061 733.05084 33.02596 0.0848 6 20.717
1.89 0.08 631.85236 585.50269 48.72504 0.1616 8 20.016
2.61 0.08 556.58459 548.97791 40.87400 0.2786 13 19.425
3.36 0.06 470.52838 454.68784 35.08147 0.3980 16 19.038
4.17 0.04 367.90213 338.78482 22.21907 0.5202 22 18.747
5.03 0.04 266.75345 254.19679 15.83485 0.6328 27 18.534
6.48 0.06 145.94379 131.20728 6.71139 0.8050 80 18.273
8.47 0.06 66.52780 61.56145 3.80246 0.9130 107 18.136
10.46 0.05 26.37516 26.44432 2.58348 0.9694 130 18.071
12.60 0.05 9.91464 10.36780 1.88054 1.0000 180 18.037
# I want on X axis = Rmean (col 1) err=Rme (col2)
Y axis = flux2 (col 4) err=fme (col5)
% cat List.10
prof001.table 1 4 2 5 errorbar b . 1 Median
prof001.table 1 3 0 0 line r - 1 Mean
Note: The column numbers are for: X Y Xerr Yerr
% cat Axes.10
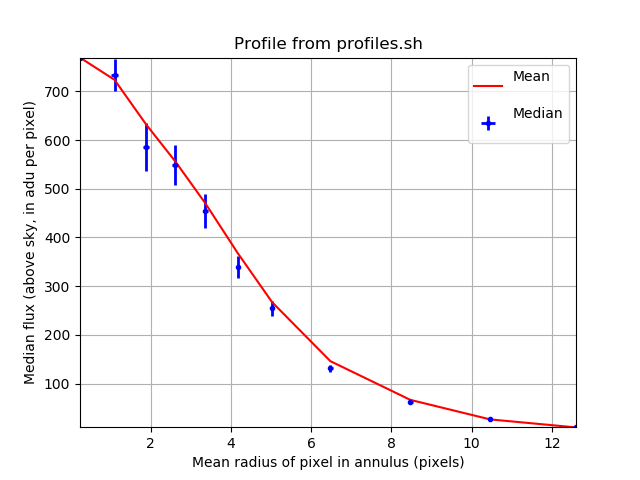
Profile from profiles.sh
0.24000 12.60000 Mean radius of pixel in annulus (pixels)
10.36780 769.29047 Median flux (above sky, in adu per pixel)
% xyplotter List.10 Axes.10 N
To see the plot:
pxy_SM_plot.py STYLE 0.24000 12.60000 10.36780 769.29047 SHOW
View plot now? (Y/N)Y
After you answer "Y" above, then you'll see the plot appear using the matplotlib
show() routine. You can adjust the scaling and placement of the data, make a hard
copy, etxc... The figure below shows what you should see:
 |
|
The example 2 plot after the matplotlib show() routine runs. The
xyplotter file is really running a python code named pxy_SM_plot.py
(which you can read about in my Big List of codes).
|
Back