Exercise 1: A WCS exercise from scratch.
I've set up a general astrometry test case that can be used to develop
and debug various WCS-derivations routines.
- A quick start list.
- What is a "wcs_setup.out" file?
- Building a simple test case.
- Viewing my test data directly.
- Running wcs_trs or wcs_2lin.
- Does my WCS header work?
A quick start list.
Here are a few simple steps with only terse explanations.
# Collect the data set
% cp -r $critfils//tdat/wcs1/* .
% ls
20170903T095516.8_acm_sci.fits	20170903T095516.8_acm_sci.wcs  README.wcs1  wcs_setup.out

# Look at the image and verify the X,Y,Ra,Dec data set
%
  ds9_open 900 900
  ds9_view 20170903T095516.8_acm_sci.fits zscale n 1
  show_wcs_points wcs_setup.out  blue 26
  wcs_center 20170903T095516.8_acm_sci.fits
04:41:30.904 +32:40:39.82 J2000 387.500   385.500
# I displayed X,Y in frame 1 and Ra,Dec in frame 0

# I strip out the WCS and do the same thing again
  remove_wcs 20170903T095516.8_acm_sci.fits
  usno_identify 20170903T095516.8_acm_sci.fits 18.0 yellow 18
  show_wcs_points wcs_setup.out  blue 26
# I had to manually enter to usno_identify:  04:41:30.904 +32:40:39.82 5.0
# I displayed X,Y in frame 1 and Ra,Dec in frame 2
# Note that I wanted to learn the (Ra,Dec) for image. I'll need this after I remove the WCS from the test image.

# I test my old 2lin method
wcs_2lin 20170903T095516.8_acm_sci.fits Y
usno_look_wcs 20170903T095516.8_acm_sci_2lin.fits Blue 20.0 1
# I overplot USNO-B1.0 sources on the calibrated image.
Since only SCO will probably ever read this, more description is not needed.
What is a "wcs_setup.out" file?
Using a generic HET acm image (20170903T095516.8_acm_sci.fits) I have composed
a simple test for WCS routines. First, let's review the type of fle that I need to
feed to wcs_trs (or severla other WCS-related coded that I use). I commnly
refer to the is file, in my various web and help docs, as the "wcs_setup.out"
file. It is a file that tells, for a collect ion targets, the name of the
taregt followed by a (free-format) line that gives the X,Y (in pixels) and
Ra,Dec of the target (both in units of degrees). I always forget this, so here is
a way I can quickly find an example of such a file:
% pwd
/home/sco
%
% find . -name wcs_setup.out -print

# I found a ton of these files all over the place!
% head ./Loc_Save/otw/src/rotafind/T/S1_acam/wcs_setup.out
508
     604.815      592.859   239.732025146   36.675251007
502
     227.906      607.108   239.697601318   36.675800323
503
     233.568      373.200   239.698242188   36.658439636


% head  ./HET_work/acam/acm_aug2017_wcs/t/wcs_setup.out
{20}..........................
     170.020      197.620   298.550140381   48.563087463
{21}..........................
     167.300      453.500   298.558715820   48.581115723
{28}..........................
     484.160       97.750   298.580871582   48.548976898


By using:  "wcs0_trs.sh --help" I can see another example:
Here is a sample wcs_setup.out file:
% head wcs_setup.out
1
773.160 698.670 70.341049194 32.669822693
2
744.270 526.320 70.345832825 32.682472229
3
687.770 529.240 70.350868225 32.681598663
The format of the numerical lines is not fixed. I usually process these
files with fortran codes driven by scripts like wcs0.sh or wcs0_trs.sh.
These codes read the coordinates as free-format. Finally, I note that the
name string is offten just an integer, but it can be any string of up to 30
characters long. It is generally not a good idea to include blank spaces
within these name strings.
Building a simple test case.
Now that the computer crapola is explaind, how do we compose a simple
test case? Here is how I did it with a raw acm image:
I took a random acm image: 20170903T095516.8_acm_sci.fits is my FITS image.
NOTE: This was originally in:
/home/sco/HET_work/acm_nights/20170903/acm
but I have save a version of this in my critical files directory ($critfils):
/home/sco/sco/codes/fortran/gfortran_compiler/lmgf/src/critical_files/tdat/wcs1
Here I store the image and the  wcs_setup.out file for this exercise. Note
that I also save a renamed version of wcs_setup.out  20170903T095516.8_acm_sci.wcs

I need to create the basic input file for my wcs routine:
name(up to 30 chars)
Xpix  Ypix    RA_degrees  DEC_degrees

I use the routine "usno_identify" to show the acm image in the left
and the DSS image in the right.
% usno_identify 20170903T095516.8_acm_sci.fits 18.0 yellow 18

I manually build the finding chart and print out the region files for each side
of the chart:
  XY_acm.reg   == X,Y coordinates in (image) pixels for my 6 stars
  RD_dss.reg   == Ra,Dec coordinates in (fk5) degrees for my 6 stars

Here are the files I made:
% cat XY_acm.reg
# Region file format: DS9 version 4.1
# Filename: 20170903T095516.8_acm_sci.fits
global color=green dashlist=8 3 width=1 font="helvetica 10 normal roman" select=1 highlite=1 dash=0 fixed=0 edit=1 move=1 delete=1 include=1 source=1
image
circle(620.26362,292.40572,29.031808) # width=4 font="helvetica 24 normal roman" text={1}
circle(588.11372,469.2427,19.670474) # width=4 font="helvetica 24 normal roman" text={2}
circle(513.44529,503.5452,23.341284) # width=4 font="helvetica 24 normal roman" text={3}
circle(384.47278,246.24405,15.757904) # width=4 font="helvetica 24 normal roman" text={4}
circle(162.06127,435.88516,12.478344) # width=4 font="helvetica 24 normal roman" text={5}
circle(180.21643,204.96274,17.230052) # width=4 font="helvetica 24 normal roman" text={6}

% cat RD_dss.reg
# Region file format: DS9 version 4.1
# Filename: dss.fits
global color=green dashlist=8 3 width=1 font="helvetica 10 normal roman" select=1 highlite=1 dash=0 fixed=0 edit=1 move=1 delete=1 include=1 source=1
fk5
# text(70.360184,32.698429) color=yellow font="helvetica 18 normal roman" text={1}
# text(70.360405,32.684849) color=yellow font="helvetica 18 normal roman" text={2}
# text(70.366707,32.681404) color=yellow font="helvetica 18 normal roman" text={3}
# text(70.38147,32.699276) color=yellow font="helvetica 18 normal roman" text={4}
# text(70.398491,32.682453) color=yellow font="helvetica 18 normal roman" text={5}
# text(70.399979,32.69997) color=yellow font="helvetica 18 normal roman" text={6}

Using the file above, I manually created my wcs_setup.out file:
% cat wcs_setup.out
1
620.26362,292.40572  70.360184 32.698429
2
588.11372,469.2427   70.360405 32.684849
3
513.44529,503.5452   70.366707 32.681404
4
384.47278,246.24405  70.38147 32.699276
5
162.06127,435.88516  70.398491 32.682453
6
180.21643,204.96274 70.399979 32.69997

I save this file in $critfils/tdat/wcs1/ as:
 20170903T095516.8_acm_sci.wcs  and   wcs_setup.out
I show below the finder chart I made in this process using the usno_identify code.
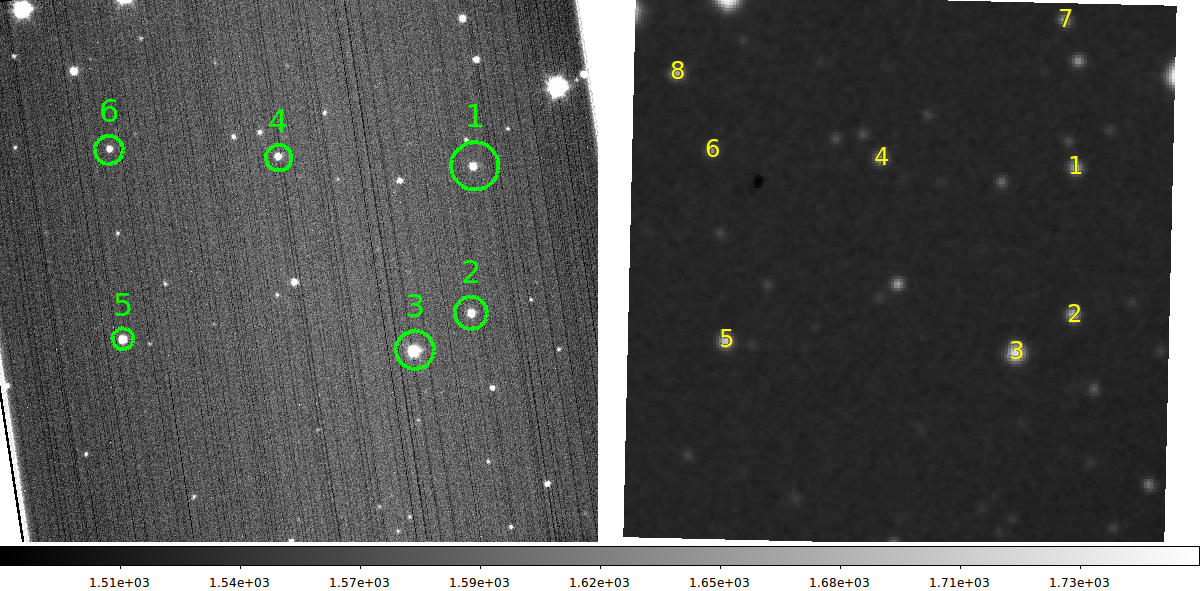 |
From a random acm image I select 6 stars and measure their positions in
image pixel coordinates (left) and celestial Ra,Dec coordinates (right).
% usno_identify 20170903T095516.8_acm_sci.fits 18.0 yellow 18

I manually build the finding chart and print out the region files for each side
of the chart:
  XY_acm.reg   == X,Y coordinates in (image) pixels for my 6 stars
  RD_dss.reg   == Ra,Dec coordinates in (fk5) degrees for my 6 stars
Here are the files I made:

% cat XY_acm.reg
# Region file format: DS9 version 4.1
# Filename: 20170903T095516.8_acm_sci.fits
image
circle(620.26362,292.40572,29.031808) # width=4 font="helvetica 24 normal roman" text={1}
circle(588.11372,469.2427,19.670474) # width=4 font="helvetica 24 normal roman" text={2}
circle(513.44529,503.5452,23.341284) # width=4 font="helvetica 24 normal roman" text={3}
circle(384.47278,246.24405,15.757904) # width=4 font="helvetica 24 normal roman" text={4}
circle(162.06127,435.88516,12.478344) # width=4 font="helvetica 24 normal roman" text={5}
circle(180.21643,204.96274,17.230052) # width=4 font="helvetica 24 normal roman" text={6}

% cat RD_dss.reg
# Region file format: DS9 version 4.1
# Filename: dss.fits
fk5
# text(70.360184,32.698429) color=yellow font="helvetica 18 normal roman" text={1}
# text(70.360405,32.684849) color=yellow font="helvetica 18 normal roman" text={2}
# text(70.366707,32.681404) color=yellow font="helvetica 18 normal roman" text={3}
# text(70.38147,32.699276) color=yellow font="helvetica 18 normal roman" text={4}
# text(70.398491,32.682453) color=yellow font="helvetica 18 normal roman" text={5}
# text(70.399979,32.69997) color=yellow font="helvetica 18 normal roman" text={6}
|
Viewing my test data directly.
Once our input test file (wcs_setup.out) has been constructed we would
like to verify that everything is in order.
 |
|
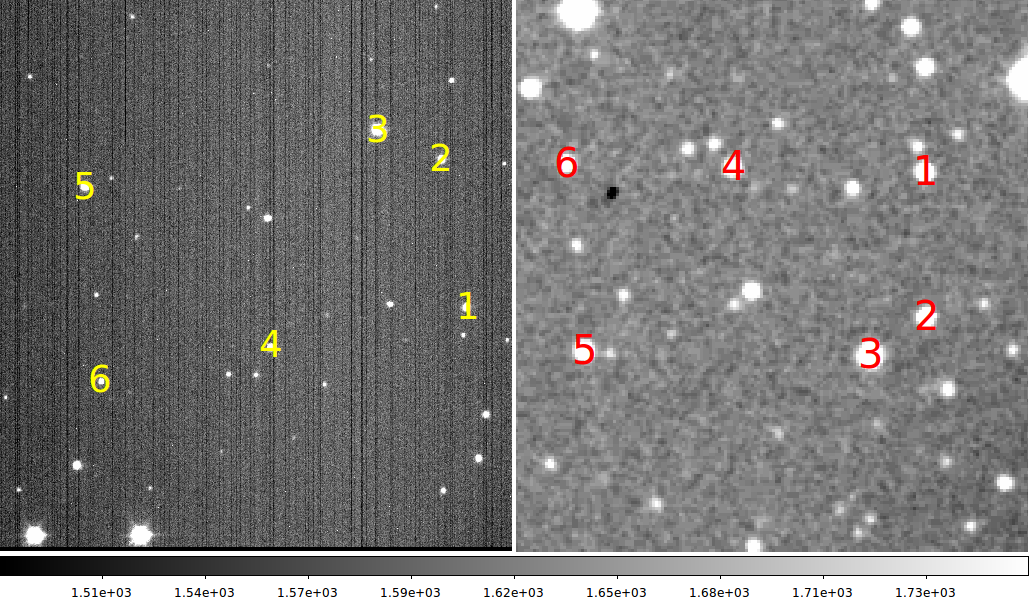
Here I have used the tool show_wcs_points to redisplay my test data points. The XY
coordinates are plotted in the left panel on the image I am calibrating. The Ra,Dec
coordinates are displayed in the right panel overplotted on a DSS image of the same
patch of sky.
|
Running wcs_trs or wcs_2lin.
I like to be able to run my tests in any random directory. I can set up a test location
with the following"
% cd /home/sco/play
% cp $critfils/tdat/wcs1/* .
% ls
20170903T095516.8_acm_sci.fits	20170903T095516.8_acm_sci.wcs  README.wcs1  wcs_setup.out
Once these files are in place we can run the wcs_trs test script.
% wcs_trs
Usage: wcs_trs 20170903T095516.8_acm_sci.fits Y
arg1 - FITS image to be calibrated
arg2 - Run in debug mode (Y/N)
NOTE: Must have wcs_setup.out already prepared
% wcs_trs 20170903T095516.8_acm_sci.fits Y
Likewise, I can similarly run wcs_2lin:
% wcs_2 lin
Usage: wcs_2lin 20170903T095516.8_acm_sci.fits Y
arg1 - FITS image to be calibrated
arg2 - Run in debug mode (Y/N)
NOTE: Must have wcs_setup.out already prepared
% wcs_2lin 20170903T095516.8_acm_sci.fits Y
Does my WCS header work?
If you have run the wcs_ routines above, your know you are told the
RMS or the fits residuals in the RA and DEC directions. However, you really
do not know if this was reliable information, and you don't know if the
resulting WCS header cards built for your new image will really work.
A simple way to etst this is to use R,Dec values from some catalog, and overplot
the positions of these targets on your new WCS-calbrated images. If things are
working, then your labeled sources should sit on top of real sources in your
image. The "usno_look_wcs" is designed for just this sort of quick sanity
check. Briefly, it uses your header to determine where in the sky your image
is located, it pulls targets from the USNO-B1.0 catalog for that area, and
it displays your image with ds9 and overplots the USNO taargets. Here is
an example using one of our tets images from above:
% usno_look_wcs 20170903T095516.8_acm_sci_2lin.fits Blue 18.75 1
The last few arguments specify how the USNO catalog is to be queried and what
ds9 image frame is to used for the display. You can read more about this by
using "usno_look_wcs --help". Here is the result of out test:
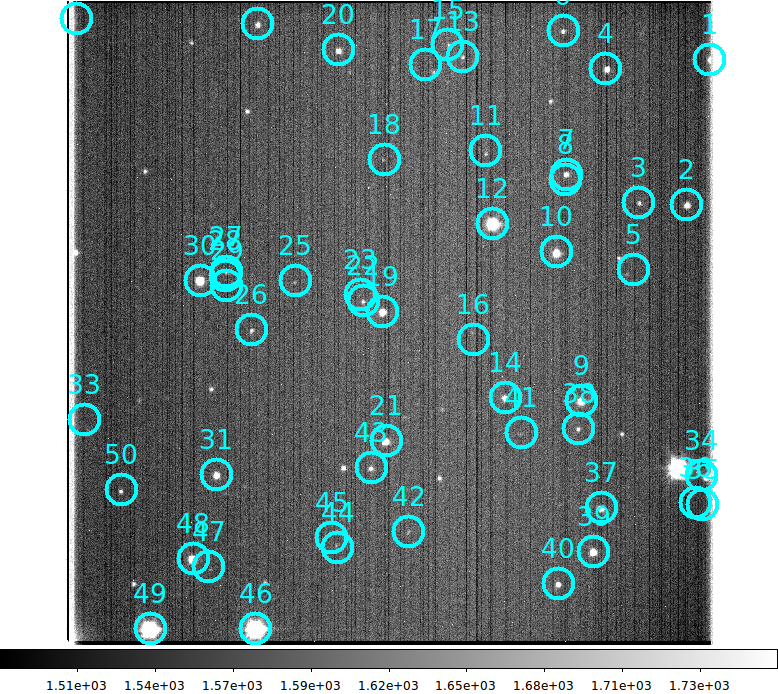 |
An output image from the usno_look_wcs routine. We used a rather deep
magnitude limite of 21.00 for the Blue magnitudes in the USNO-B1.0
catalog to overplot sources in our WCS-calbrated test image.
% usno_look_wcs 20170903T095516.8_acm_sci_2lin.fits Blue 18.75 1
|
Most of the sources have cyan-circle labels that match their positions well.
Back to SCO CODES page