 |
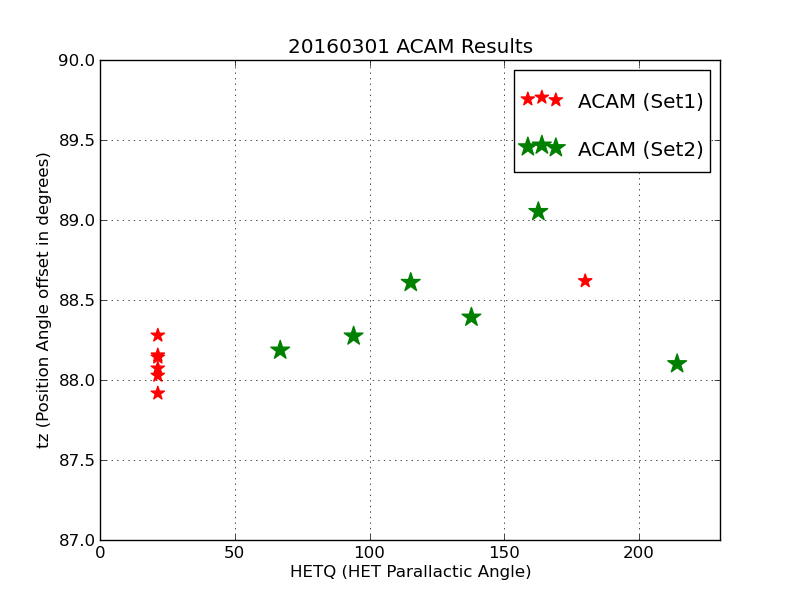
| Here is the plot I made for my data collected with WCS reductions of ACAM image taken with the HET on the night of 20160301 (UT). |
Using my output from RUN_STATS, I can make a Table file:
% cat Table.1
col01 = RMS, combined Ra,Dec residual rms in arcsec
col02 = tz, tz = Acam_PosAngle - HETQ  (degrees)
col03 = plate scale (arcsec/pixel_)
col04 = HETQ, HET parallactic angle
col05 = image name
      RMS       tz        ps          HETQ     Image
# data
     0.268    88.619    0.26947     180.000    20160301T023620.4_acm_sci.fits
     0.006    88.142    0.27072      21.452    20160301T030347.7_acm_sci.fits
     0.339    87.917    0.27156      21.452    20160301T031055.4_acm_sci.fits
     0.496    88.028    0.27109      21.452    20160301T031747.2_acm_sci.fits
     0.210    88.073    0.27105      21.452    20160301T032232.1_acm_sci.fits
     0.354    88.155    0.27009      21.452    20160301T032733.5_acm_sci.fits
     0.292    88.279    0.27213      21.452    20160301T033146.9_acm_sci.fits
     0.343    88.186    0.27051      66.856    20160301T034459.0_acm_sci.fits
     0.502    88.274    0.27211      94.089    20160301T035356.8_acm_sci.fits
     0.520    88.609    0.27252     115.276    20160301T040708.6_acm_sci.fits
     0.264    88.392    0.27085     137.787    20160301T041917.6_acm_sci.fits
     0.006    89.052    0.26887     162.610    20160301T043419.8_acm_sci.fits
     0.380    86.651    0.27047     189.374    20160301T044319.0_acm_sci.fits
     0.546    88.101    0.27107     214.103    20160301T045456.8_acm_sci.fits
Suppose I want to plot tz as a function of HETQ?
%  colget.py -h
usage: colget.py [-h] [-v] arg1 arg2 arg3

positional arguments:
  arg1           Input table-style file
  arg2           Column number of data to be extracted
  arg3           Name of data column being extracted

optional arguments:
  -h, --help     show this help message and exit
  -v, --verbose  Verbose responses
First I pull out the quantities I want and paste them into a single two column file. I look at my awk and sed notes to recall how the heck to do this!
% colget.py Table.1 2 tz
Created list.tz with 14 lines

% colget.py Table.1 4 HETQ
Created list.HETQ with 14 lines

% paste list.HETQ list.tz > big.2col
% cat big.2col
180.000 88.619
21.452  88.142
21.452  87.917
21.452  88.028
21.452  88.073
21.452  88.155
21.452  88.279
66.856  88.186
94.089  88.274
115.276 88.609
137.787 88.392
162.610 89.052
189.374 86.651
214.103 88.101
Becasue I want to demo how I will plot multiple sets of data, I split my file big.2col into two files: f.1 and f.2. Then I slap the headers on that I need for running pxy_SM_scat.py to get my plot. I show my final files, the meta file I build manually (style.1), and the command line call to pxy_SM_scat.py I use to make the plot:
% cat f.1
r * 100
ACAM (Set1)
180.000 88.619
21.452  88.142
21.452  87.917
21.452  88.028
21.452  88.073
21.452  88.155
21.452  88.279

% cat f.2
g * 200
ACAM (Set2)
66.856  88.186
94.089  88.274
115.276 88.609
137.787 88.392
162.610 89.052
189.374 86.651
214.103 88.101

% cat style.1
ACAM Results
HETQ (HET Parallactic Angle)
tz (Position Angle offset in degrees)
f.1
f.2

% pxy_SM_scat.py style.1 0 230 87 90
Below I show the plot I made this way. I built the web figure using build_htm_img to make this figure.
|
| Here is the plot I made for my data collected with WCS reductions of ACAM image taken with the HET on the night of 20160301 (UT). |