Spatial light distribution.
We need a way to quickly, even if crudely, represent the
spatial (sky) distribution for the fiber spectra gathered
with each IFU.
- A review of some old VIRUS-P tools.
- View and initial processing.
- Map the fiber locations.
- Integrate signal in fibers.
- Build fibers signal list and make a map.
- The total package.
- mid-Apr2016 work using
images of globular clusters from 20160409.
- Faulkner-style working notes.
A review of some old VIRUS-P tools.
A set of test data and run scripts for VIRUS-P data are found in:
$tdata/T_runs/fibers/ex0_treat1
The main work-horse script is:
.../fibers/ex0_treat1/S/fibs2
These scripts use sky flats and obkect frames to build
crude 2-d maps of the on-sky light distribution. The main
script, fibs2, does the work, but it is build to specificaly
handle the 246 VIRUS-P fibers. The pieces inside fibs2 are
fairly general. I'll review them here and then proceed to
developing similar scripts for VIRUS data.
clip_fibsx.sh - use a well-exposed flat to map the light
                distribution in the spatial direction.

Usage: clip_fibsx.sh a.fits 528 2 none
arg1 - input FITS image
arg2 - fixed X (column) for search
arg3 - smoothing radius in X
arg4 - output image name (none for no image)


peaks.sh - use the average signal from clip_fibsx.sh to locate
           the peaks of fiber positions.

Usage: peaks.sh infile 1 900.0
arg1 - input file name
arg2 - search window radius (iwid,integer)
arg3 - minimum allowed Ypeak value


clip_fibsigx.sh - Integrate signal at the derived fiber locations
                  and create a file of flux values.
Usage: clip_fibsigx.sh a.fits peaks.txt 528 2
arg1 - input FITS image
arg2 - peaks file (from peaks.sh)
arg3 - fixed X (column) that peak file corresponds to
arg4 - integration window radius in X
The fibs2 script uses some fairly nice python matplotlib codes to
plot the results. The current plot codes are tightly tied to
VIRUS-P and so I'll not mention them here. I'll use these plot
codes as a starting point for building some VIRUS plot tools.
View and initial processing.
The vir_view tool, when run with arg4="p", will perform some simple
processing: bias subtraction and X,Y flipping to get uniform orientation.
If processing occurs, two types of images are made: compressed in Y for
convenient viewing (e.g. LL_###.fits) and the full Y version (o_LU_###.fits).
The "###" denotes the IFUSLOT value. H
% cat Base.Path
/home/sco/VIRUS_Sample/20160409

% vir_view 201 04 094 p

% ls
Base.Path  Frame.3  label.reg    LU_094.fits    o_LL.fits      o_RL_094.fits  o_RU.fits    RL.fits      S/
Frame.1    Frame.4  LL_094.fits  LU.fits        o_LU_094.fits  o_RL.fits      p1/          RU_094.fits  vir_094.png
Frame.2    l.1      LL.fits      o_LL_094.fits  o_LU.fits      o_RU_094.fits  RL_094.fits  RU.fits
The Frame.# files simply list the full-path names of the images viewd.
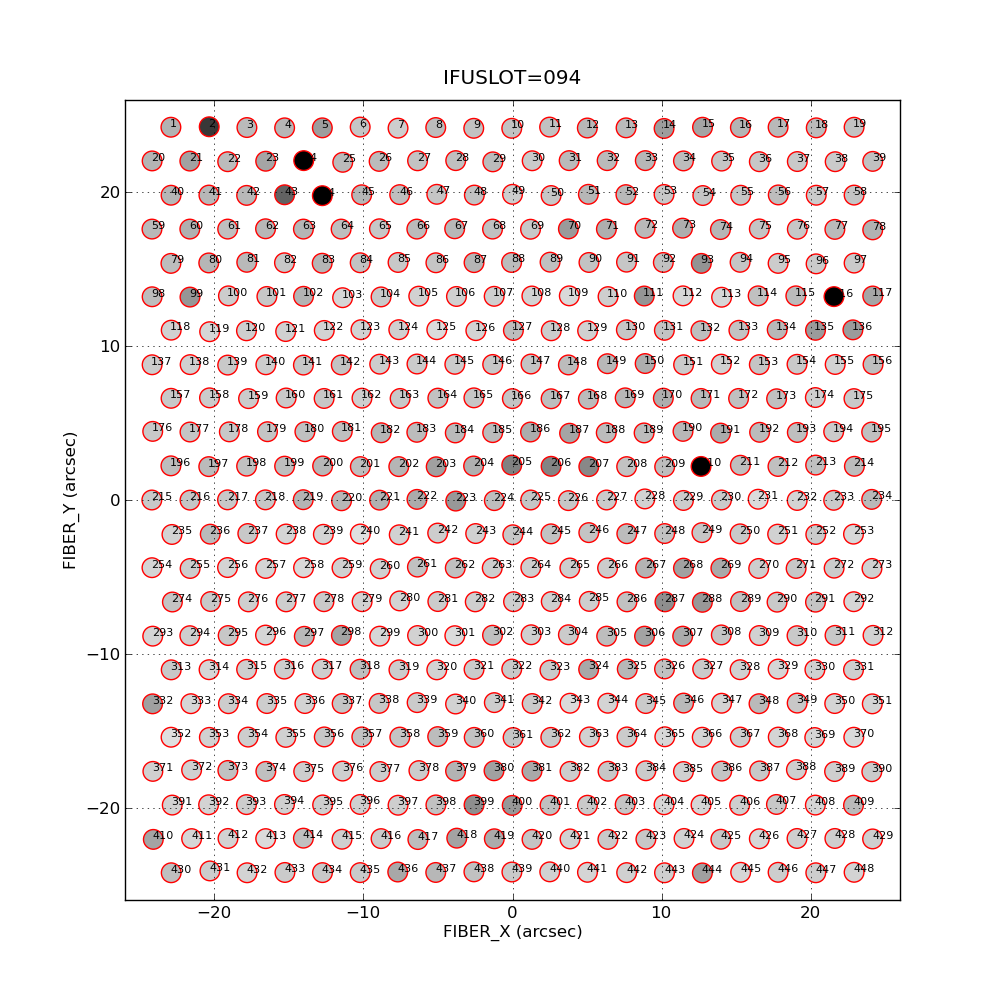
The processed images are present, and a png file (vir_094.png) that shows
a labeled (by IFUSLOT) version of the images. For the remaining scripts shown
here, I assume you have viewed and initially processed the images with vir_view.
Map the fiber locations.
The routine fibermapX identifies the fiber locations along
a column (constant X) in a well-exposed flat image.
Usage: fibermapX LL.fits 532 9000 Y 30000
arg1 - name of (flat) image
arg2 - X (column number) of slice
arg3 - minimum allowed Ypeak value
arg4 - build and view plots
arg5 - maximum signal for plot (Y-axis)

% fibermapX o_RL_094.fits 532 9000 Y 28000

This makes the files:

Peaks_532_o_RL_094
  ASCII file of peak positions

Peaks_532_o_RL_094_vp_fibs2.png
  plot of the Y marginal distribution and the derived peaks

**** To do all VIRUS images for an IFUSLOT value:
% fibermapX_all 094 55000
Usage: fibermapX_all 094 55000
arg1 - IFUSLOT value
arg2 - max signal for plot Y axis
The last script presently has a number of hard-coded paramters. Finally,
one thing to note is that you must have a well-exposed set of flats
to use with fibermapX. I find that twilight sky flats exposed to a
peak level of around 20000 ADU (and less than 35000 ADU) works extremely
well. The ldls flats seem to be more problematic (they are variable across
the IHMP) but can work also. Below is a typical peaks plot from
fibermapX for the LL channel of IFUSLOT=094
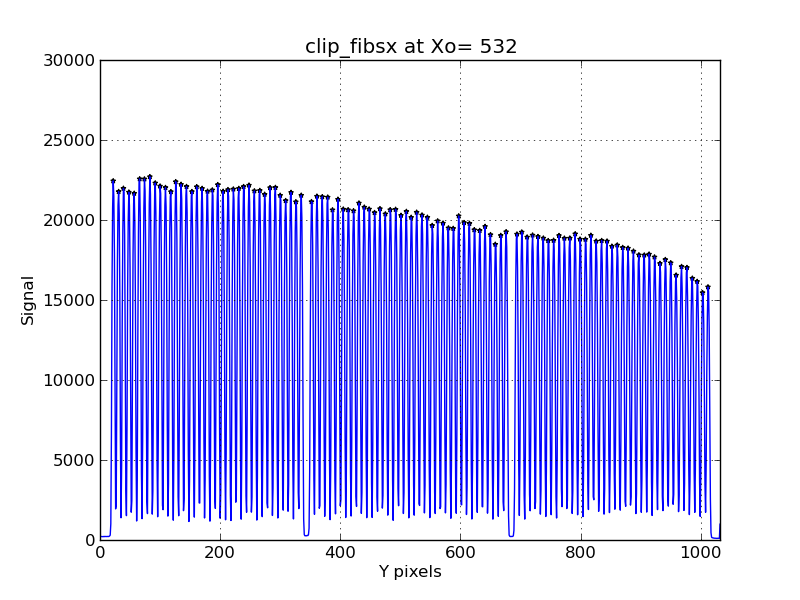 |
The Y marginal distribution (above bias) computed
for the LL channel in IFUSLOT=094 with the fibermapX
routine:
% fibermapX ../o_LL_094.fits 532 9000 Y 28000
Usage: fibermapX LL.fits 532 9000 Y 30000
arg1 - name of (flat) image
arg2 - X (column number) of slice
arg3 - minimum allowed Ypeak value
arg4 - build and view plots
arg5 - maximum signal for plot (Y-axis)
The blue curve represents the flux distribution
along the column X=532, and the black dots show the
locations of identified peaks. These are the locations
where we'll want to intgerate a signal for each fiber in order to
build a 2-D image of the sky field in a science observation.
The important file for later use is the ASCII file that
lists the peak (fiber) Y positions, in this case the
file named "Peaks_532_o_LL_094". We can use such files to
quickly extract maps from other object frames obtained
with VIRUS IFUSLOT=094.
|
The code that does the plotting here is python/virusP/vp_fibs2.py. This
was an hold package I used for VIRUS-P work last year. I have
copied a the old version to vp_fibs2_orig.py and I am now hacking
up vp_fibs2.py for my current work.
Integrate signal in fibers.
First, use vir_view to process the images for the
094 IFUSLOT for our NGC5204 image set:
vir_view 300 02 094 p

To do all 4 images for IFUSLOT=094
fiber_signals_all 094 532 4

This runs the code clip_fibsigx.sh.
Usage:  clip_fibsigx.sh a.fits peaks.txt 528 2
arg1 - input FITS image
arg2 - peaks file (from peaks.sh)
arg3 - fixed X (column) that peak file corresponds to
arg4 - integration window radius in X

The output of each run from clip_fibsigx.sh goes to a file
with a name like:   Signals.LL   (fibers signals for image LL)

Xo= 532 , o_LL_094.fits
   1        96.611        22.000      0.169475
   2       201.389        31.000      0.335057
   3        89.167        39.000      0.157710
   4        93.389        48.000      0.164382
....
 107        71.723       968.000      0.130142
 108        69.056       977.000      0.125928
 109        62.723       986.000      0.115919
 110        72.278       994.000      0.131020
 111       122.611      1003.000      0.210563
 112        64.834      1012.000      0.119255
-----    ----------   ------------   ------------
peak       Signal       Yposition     Grey_level

NOTE: For VIRUS images we shoud always have 112 fibers per image.
Build fibers signal list and make a map.
Now we'll run some code to build a file that tells us the X,Y of each
fiber (in units of arcseconds) and the signal measures for each fiber.
To get the fiber list:
% get_virus_fibers 094

*** If there is no fiber file specifically for IFUSLOT=094
    then a general file is pulled. In either case, the local
    file named "VIR.all_rot" is established.  This file is
    processed with "vir_ifu_fibers.sh"  to build local files:
    fibers.xy  fibers.xy_explain  fibers.xy_names

To build the list of signal and make a map:
% vir_signal_list.sh 094 $1 $2 > SIGS
% vir_signals_map.py -v SIGS 8 1 100
 |
A sample of a fiber signals map made with matplotlib
via the routine vir_signals_map.py. This represents the
IFUSLOT=094 frome for my NGC5240 observation. The png image
was made with:
% vir_signals_map.py -v SIGS 8 1 100
The file SIGS was made with a run of vir_signal_list.sh to
combine signals for every fiber in the IFU (i.e. combine the
4 amplifier-specific file). The second argument (8) specifies
the size of the text used to label the fibers. I find that
TextSize=8 is just readble for my shitty eyes. The values of
1 and 100 are actually not used. Initially I was going to use these
as z1,z2 values to normalize and adjust the greyscale levels
in the images. I found this to be a big hassle. I do the greyscale
normalization in vir_signal_list.sh, but this is still a hassle. It
seems to take many attempts before I get something that looks
reasonable good. Hence, I'll spend some time developing a FITS
version of this map that I can view and interactively adjust with ds9.
|
The total package.
As with all things VIRUS, there is never really a final package, but for
now I am building a final set of commands near the end of vir_view that
will allow one to pretty quickly build IFU maps. I just show the last
bit of code (that will surely evolve) and a sample run.
#--------------------------------------------------------
# Continue processing if 1) desired and 2) possible

PANS="N"
if [ $treat = "p" ]
then
 printf "Continue processing through to ifu maps? (Y/N):"
 read PANS
fi

if [ $PANS = "Y" ]
then
 xcol="532"
 z1="1"
 z2="1000"
 fiber_signals_all $ifuslot $xcol 4
 vir_signal_list.sh $ifuslot $z1 $z2 > SIGS
 wc -l SIGS > num_in_SIGS
 read numSIGS comm < num_in_SIGS
 if [ $numSIGS = "450" ]
 then
  vir_signals_map.py -v SIGS 8 $z1 $z2
  virus_signals_fits.sh SIGS SIGNALS_$ifuslot.fits
  vir_clean
 fi
fi
#-------------------------------------------------------

% ls
Base.Path  Peaks_532_o_LL_094  Peaks_532_o_LU_094  Peaks_532_o_RL_094  Peaks_532_o_RU_094

% vir_view 300 02 094 p

% ls
Base.Path      o_LU_094.fits  o_RU_094.fits       Peaks_532_o_LU_094  Peaks_532_o_RU_094
o_LL_094.fits  o_RL_094.fits  Peaks_532_o_LL_094  Peaks_532_o_RL_094  plot.png
Notice that a lot of intermediate files are cleaned away (by the vir_clean
script). This may or may not change. For now I reatin the simple python-built
map of the fiber flux on the sky (plot.png) and the uncompressed, but bias-subtracted
and re-oriented VIRUS framtes (o_LL_094.fits , etc...). The Peak files are also
retained since these may be used to process other images. Finally, the call to
virus_signals_fits.sh is an early attempt to generate a simple FITS file of
the 2d light distribution in the IFU. I show an early example from this
code below.
 |
|
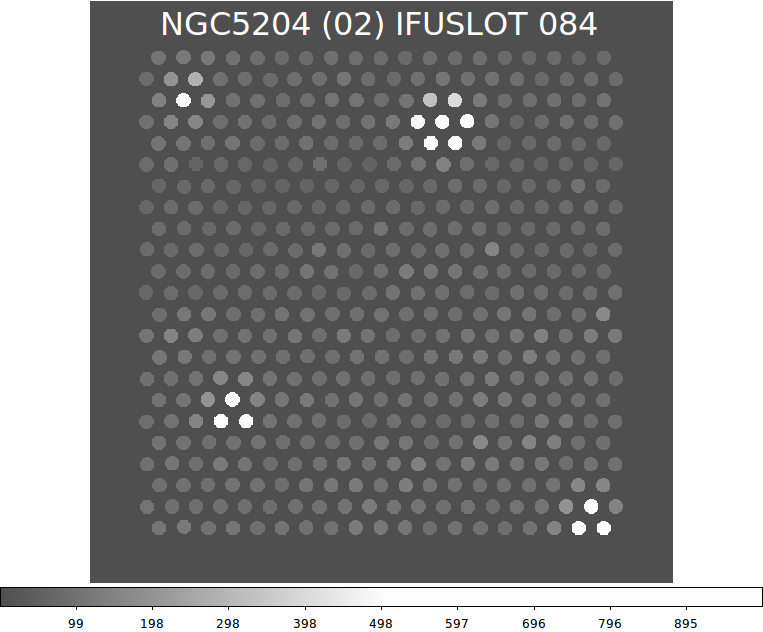
The IFUSLOT=084 image for NGC5204 built with the virus_signals_fits.sh
routine. This is in the eraly stages of development, but we see several
strong detections.
|
At this stage I have a system to process images and create a
crude spatial map of the light distribution on the sky. Based
on the flux trends along the VIRUS slits I think I have the
amplifier direction accounted for. However, I have yet to make
a positive star identification. I want to view all of the IFU
fields. Here is a good chane to review the process. I'll do
each IFU in a separate sub-directory.
% mkdir ifu_094

Process the skyflat IFU (obs=201 exp=04) for the desierd IFU:
% vir_view 201 04 094 p        # initial view and process
% fibermapX_all 094            # build fiber peak file
% vir_view 300 02 094 p        # view object data

Note: Now I can view the plot.png (matplotlib) file or the
      SIGNALS_094.fits file (with ds9). Note that I have
      commented out the use of vir_clean inside the vir_view
      package for now. I can quickly clean up my working
      directory by running vir_clean manually.
As of Apr18,2016 I am still finding some apparent errors in
constructing VIRUS images. Some of the problems seem to be
connected with tehe data, and others are connected with a
misording of the fibers in each amplifier. I am summarizing here
mid-Apr2016 work using
images of globular clusters from 20160409. After this work,
I was able to change the fiber ordering recipe used in
vir_signal_list.sh and produce the apparently successful
image below:
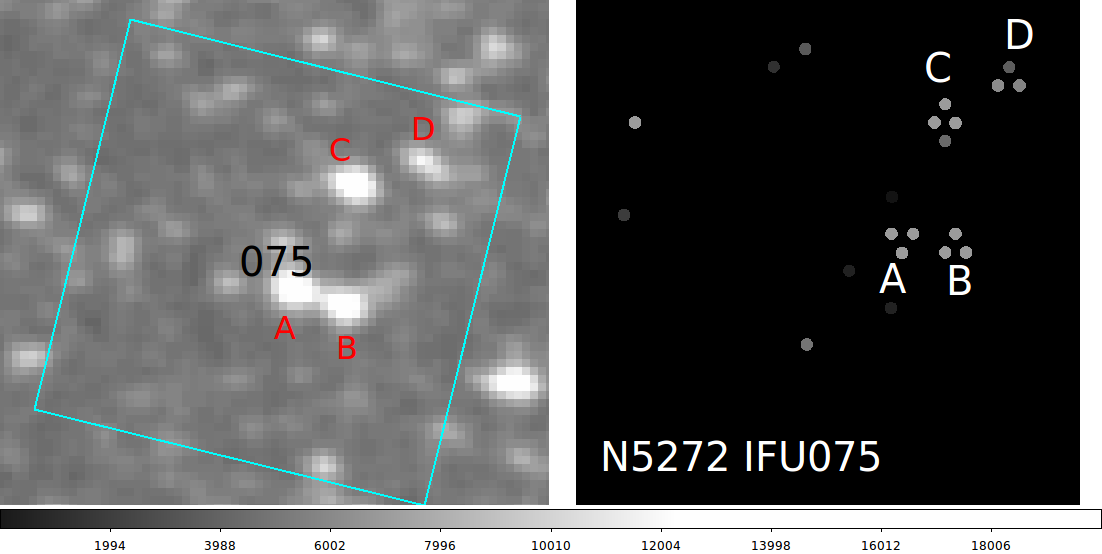 |
The IFUSLOT=075 field in NGC5272. The stars A,B,C,D
are shown in a gstar image (left) and the in the
fiber reconstruction map (right). The order of the
fiber assembly in vir_signal_list.sh appears to have been
set properly now (late Apr18,2016). The fiber images was
made with virus_signals_fits.sh. Here is the full sequence
used to build the map on the right:
ifuslot="075"
xcol="532"
z1="1"
z2="1000"
vir_signal_list.sh $ifuslot $z1 $z2 > SIGS
virus_signals_fits.sh SIGS SIGNALS_$ifuslot.fits
|
Back to VIRUS_LRS2 Tools page