meangrowthcurve.sh
Updated: June22,2020
Use two files from a profiles.sh run
(Radial_Profile.Bins and profiles_full.table) to compute a mean flux growth
curve using all sources. Initial the points are binned a median-smoothed, and
then a smooth splibe curve is computed that can be used for applying aperture
corrections.
% meangrowthcurve.sh  --help

usage: meangrowthcurve.sh a.fits [-v] [-h] [-m method]
arg1 = name of FITS image processed by profiles.sh
Additional options:
     -v  = print verbose comments and run in debug mode
     -h  = show a help file and then exit
     -m  = method (can be "none")

% meangrowthcurve.sh 20191018T024545.3_acm_sci.fits
 |
|
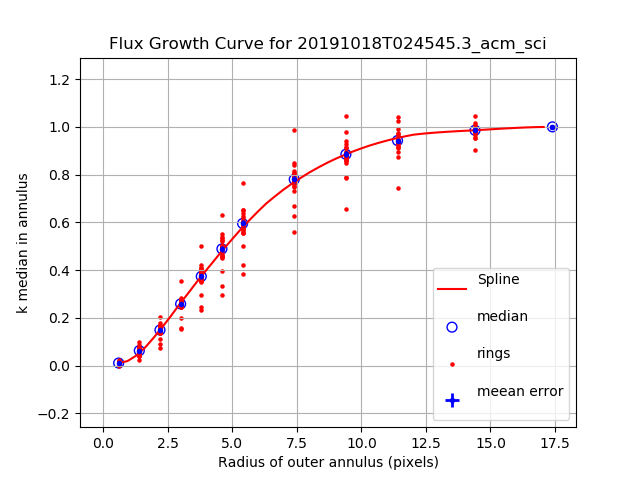
The blue points with error bars are median points computed for the
flux growth curve of an image using the code
meangrowthcurve.sh.
Beacuse N=26 sources were measured in this image, the standar error
attached to eah point was quite small, and appear as small dots in the
median points (large open circles). The red points
are the original points from individual annuli from every ssource
collected in a run of the profiles.sh code. The red line is a smoothing
spline fitted to the median points for use in a lookup table that can
be used to apply the final aperture corrections to magnitudes compted
with the photometry code imgcat0_apmags.
|
Just for completeness, and because I always seem to forget this stuff, here is
the files I used to make this plot.
meanGC.table
  The median and mean statistics for each ring from each profile measured in
  the image. These are the blue points in the plot.

profiles_full.table
  The original profile points from eacg source measured with the profiles.sh
  code in a step previous to meangrowthcurve.sh. These are the red points in
  the plot.

GCspline.table
  The spline-smoothed growth curve. This is the red line in the plot.

% cat List.10
meanGC.table   1 2 0 0         pointopen b o 50   median
meanGC.table   1 2 0 5         errorbar  b . 5    meean error
profiles_full.table 11 6 0 0   point     r o 5   rings
GCspline.table       1 2 0 0   line      r - 5   Spline

% cat Axes.10
Flux Growth Curve for 20191018T024545.3_acm_sci
  0.0  18.0     Radius of outer annulus (pixels)
 -0.1 1.2       k median in annulus

% xyplotter List.10 Axes.10 N    # This makes the plot!
The table file named GCspline.table also has a thrir column named ApCor. This is
the aprture correction, in units of instrumental magnitude that can be used as a
lookup table to correct magnitude derived in optimally sized apertures. This is
the table used in the final part of the photometry code
imgcat0_apmags
to compute final instumental aperture magnitudes for sources in an image.
Back to calling page