A quick look at galaxy profiles (the NGC3379 field).
Last updated: Dec 19,2018

We can used ds9_profiles to quickly view and measure FITS images. As the name implies, it enables us to measure light profile measured in aperture defined with ellipse, box and cirle region markers defined with the ds9 gui. You can grab THIS LINK a set of test image s here that include Rsco2093.fits and make a few quick runs with ds9_profiles: "


# After the retrieval to (for instance) Downloads
% mv ~sco/Downloads/TestData.tar.gz . 
% tar xvzf TestData.tar.gz 
Test_ds9_profiles/
Test_ds9_profiles/work0/
Test_ds9_profiles/work0/S/
Test_ds9_profiles/work0/S/README
Test_ds9_profiles/images/
Test_ds9_profiles/images/Rsco2039.fits
Test_ds9_profiles/images/20181111T032020.1_056RL_flt.fits
Test_ds9_profiles/images/20181115T044859.1_056RL_cmp.fits
Test_ds9_profiles/images/20180403T075403.4_acm_sci_proc.fits
Test_ds9_profiles/images/README.Test_ds9_profiles_images
% cd Test_ds9_profiles/ 
% mkdir test1 
% cd test1 
% cp ../images/Rsco2039.fits . 
% ds9_profiles Rsco2039.fits default default none N  


A portion of Rsco2039.fits that contains the Sc galaxy NGC3389. I set the ds9 region type to Ellipse and visually set the marker around the galaxy. To reproduce the ds9_profile results shown here, I record that I used:

Recorded the ds9 (image) parameters for this ellipse marker:
Center   571.19  924.62 
Radius   56.06 29.51
Angle    15.31 

These parameter choices have no strong physical significance, but are recorded only as a way of enabling the used to check that ds9_profiles is performing as expected. The thick white eelipse marker indicates the extent of the galaxy profile, and the two thin blue curves indicate the background annulus used to compute the LOCA_SKY value (the default method). As you can see, this sky annulus is probably set to close to the galaxy ellipse and is probably too small for this galaxy. These issues will be cobered elsewhere.


The default profile plot produced by ds9_profiles. The red points are the indiviual pixel values, and the green circel represent the growth curve. The tiny blue points indicate the portion of the groeth curve fitted with a low-order polycomial and used to estimate the errctive radius (k=0.5) of the galaxy. As can be seen, the growth curve never reaches a reasonably flat area, indicating that we have set the ellipse major axis at a value that is probably too small. Moreover, since the inner sky annulus is quite close to this ellispe, we have probably overestimated the local sky background.


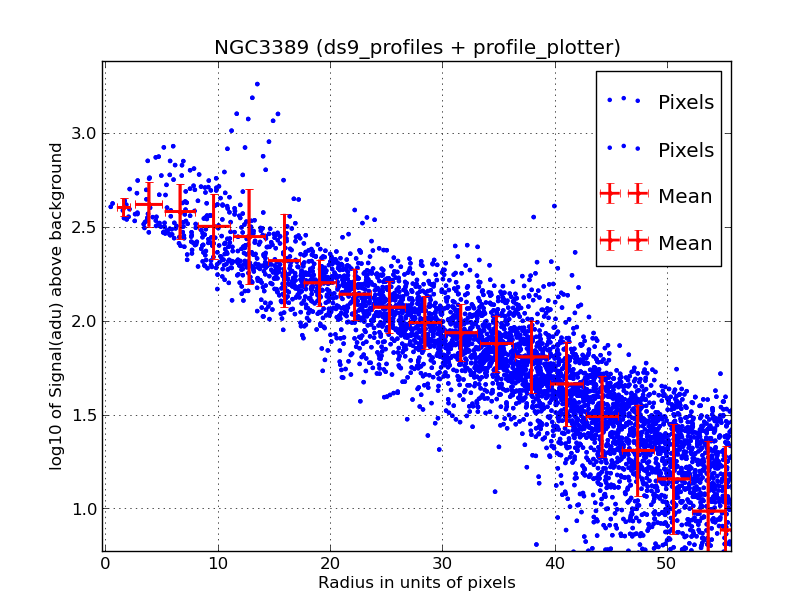
This is a more easily interpretted radial brightness profile created with the profile_plotter routine:

% cd ap_1 
% profile_plotter
Usage: profile_plotter rad "log(I-Isky)" N 
arg1 - Quantity to plot on X axis (can be q)   
arg2 - Quantity to plot on Y axis (can be q)  
arg3 - run in debug/verbose mode (Y/N)

% profile_plotter rad "log(I-Isky)" N 
Enter rad [min,max,nbins,binwid] ( 0.8 14.0 12 1.2 ): 0 60 20 5 

We can see that by plotting the Y-axis on a log scale we get a roughly straight line as expected with a late-type disk galaxy like NGC3389. Note that a lot of single pixels (the small blue points) depart from this simple linear trend. These are likely associated with the high spatial frequency features in the image. The red error bars indicaet the mean errors in radial (elliptical) bins. These values are computed in the run of profile_plotter and can be adjusted easily on each run.


Back to computer basics page