|
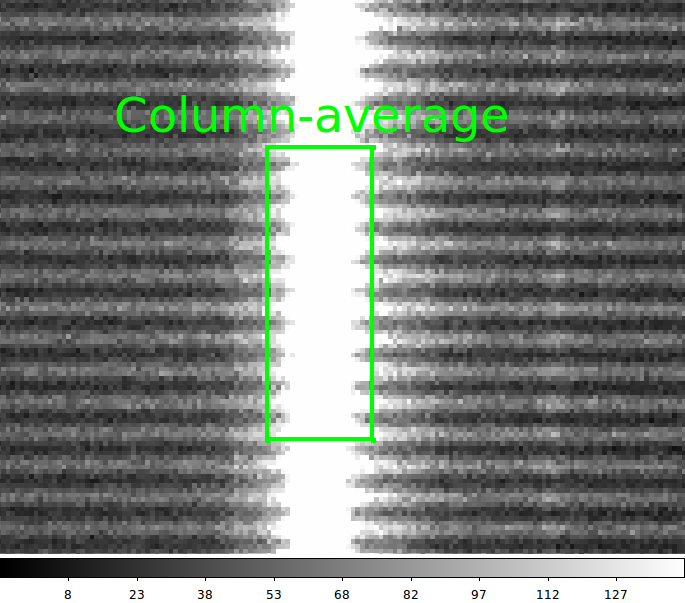
Using the box region drawn in the previous figure, a marginal distribution of
the LRS2 line flux is computed with column averaging. A set of points near
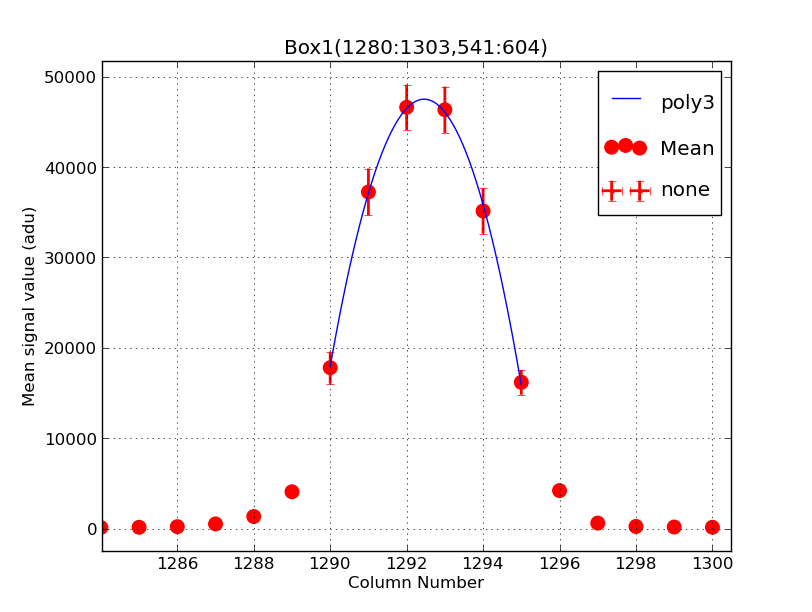
the peak of the distribution was selected interactively (using the
using the table_xy_boxclean) and a simple parabolic curve was fit to the
data points. This can be used to estimate the center position and peak
flux level in the line. Note that this is not meant to be a formal model of the
line flux, which would require formal background subtraction. Rather, this sort
or exercise is meant to suit a variety of practical HET needs like addressing
flux changes due to exposure time changes in the cal script, adverse temperature
affects on the red/blue light guides in the cals system, the interodution
of a new filter in the optical system, etc....
|