curve_maker
Generate model model curve files. The user is given the option for each
curve set of plotting the curve in a pre-existing plot file (see
xyplotter and
xyplotter_auto).
% curve_maker --help

Usage: curve_maker 20 Y
arg1 - iplot (IP) value (i.e. ListIP,Axes,IP)
arg2 - run in debug/verbose mode
# This assume you have made List.20,Axes.20 in the xyplotter style.

# To get a list of recognized curve types:"
% curve_maker  L N
Below are some links to tarball files that you can use to pull over simple example
files and run the codes yourself.
- Example1: Plot 1-d gaussians.
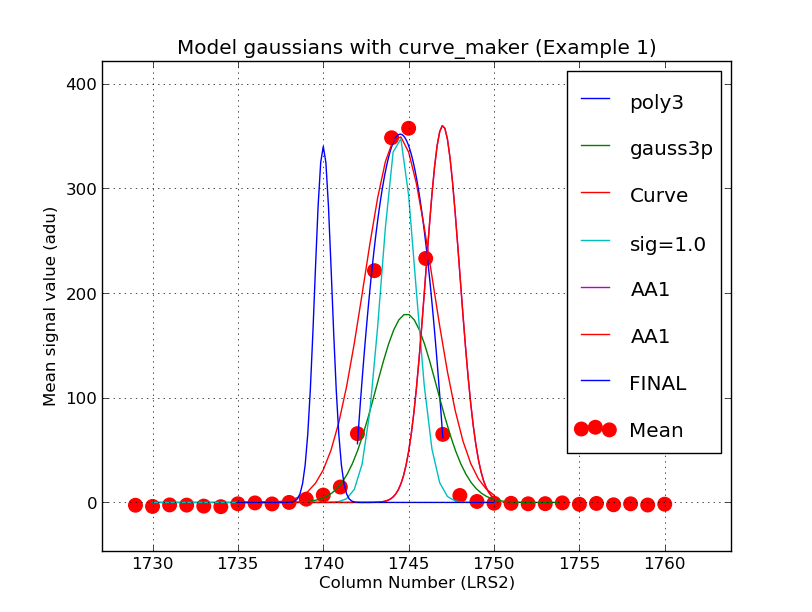 |
A setof model gaussion curves generated wit curve_maker in the Example1
tarball. Here is what I dis after I downloaded the tarball file.
tar xvf curve_maker_example1.tar
cd ap_1
xyplotter List.1 Axes.1
Actually, I edited the title line a little by changing the first line in
the Axes.1 file. Also, xyplotter uses the matplotlib show() function to view
the plot. During this stage I used the icons at the bottom of the plot gui
to change the scaling and placement of the plot a little bit.
|
Back to SCO CODES page