cdfp2reg.sh
Last updated: Jun21,2020
This OTW code uses Ra,Dec coordinates from a cdfp file to generate a ds9-style
regions file. The region markers are circle of a user-specified color and
radius. The name for each marker is normally the line number, but read near
the end of this doc about how to add extra infomation, like a Blue magnitude
value, to the plotted name label.
%  cdfp2reg.sh file.cdfp 5.0 red X_pixel Y_pixel
%  cdfp2reg.sh file.cdfp 5.0 red any any

Usage: cdfp2reg.sh file 5.0 red X_pixel Y_pixel
Usage: cdfp2reg.sh file 5.0 red any any
arg1 - name of input cdfp file
arg2 - output circle region radius in units of ARCSEC
arg3 - output circle color
arg4 - name of X value (if desired, otherwise any)
arg5 - name of Y value (if desired, otherwise any)
Additional options:
     -v = print verbose comments
 --help = view a help document

ADDED Jun2020:  You can set a minimum aperture radius with local file = cdfp2reg.MinApPix
% cat cdfp2reg.MinApPix
6.0
The name of the output regions file is the name of the input CDFP file with
a ".reg" appendix. Hence, for the example above, the name of the output file
would be: file.cdfp.reg. It is worth explaining here that the first example
above is for the case where we want to use X,Y value to build the regions
file (i.e. the "physical" system). In such a case, we must have prepared a
CDFP file that contains the columns X_pixel and Y_pixel. If no matching
arg4,arg5 values are in the input CDFP file, then it is assumed that you
want to use Ra,Dec to build the regions file (i.e. the "fk5" system).
The python codes that build the actual region files for these cases are
xymake_circles.py and
make_circles.py.
The names attached to each output region is usually just the running
line number in the input cdfp file. However, if a quantity name "label" is
contined in the cdfp file, that that number (converted to an integer) is
used as the name. You can rread about an
example of using the label quantity for a name.
Notice that at the end of the example above I mention the cdfp2reg.MinApPix file.
If this file is present, then a minimum aperture radius, whether we are printing in
units of pixels or arcseconds, is specified. If this file is present, the code reads
and imposes that value. This is useful when we want to generate files forcomputing
aperture magnitudes using and input source catalog from
image_catalogs. In such catalogs we may
encounter lots of sources with only a few pixels and an equivalent radius
that is just one or 2 pixels. We'd never want to use and aperture this small. Hence, codes
line reg_from_imgcat use this capability to
create regions files with reasonable apertures for even very small/faint detections. The
figure below demonstrates this feature.
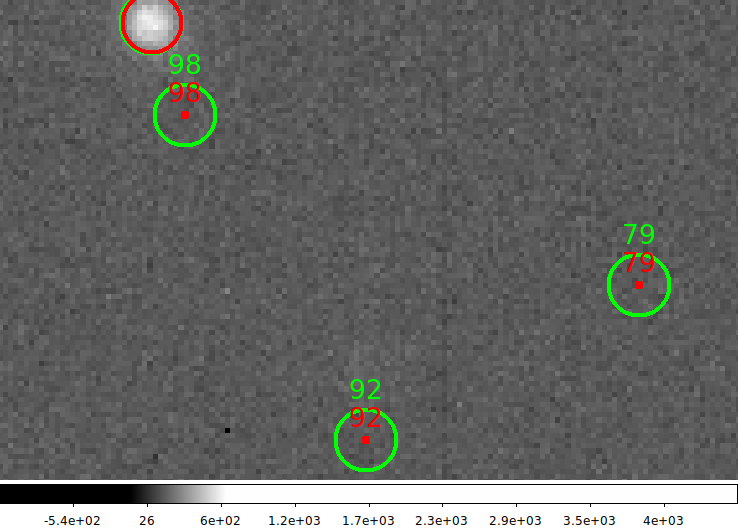 |
Here are some apertures gathered from a catalog created with the image_catalogs routine.
% cdfp2reg.sh 20191018T024545.3_acm_sci.cdfp 5.0 red Xcent Ycent
% mv 20191018T024545.3_acm_sci.cdfp.reg run1.reg
% cat cdfp2reg.MinApPix
6.0
% cdfp2reg.sh 20191018T024545.3_acm_sci.cdfp 5.0 green Xcent Ycent
% mv 20191018T024545.3_acm_sci.cdfp.reg run2.reg
For the above figure I simply displayed the image then manually loaded the
run1.reg and run2.reg files. In this cas the run1.reg marlers (red) have the
all apertures plotted with an equivalent radius based on the number of thesholded
pixels in the sours (Npix). In the run2.reg case (green), the equivalent radius
is again used, but anything smaller than the value is cdfp2reg.MinApPix is
replaced by that value.
|
Another useful routine for drawing bold, labeled circles at Ra,Dec positions
is make_circles_bold.py:
% cat set.1
11:08:47.1552 +24:08:22.7148   9.0    0.0 0.0    cirle      green   "TextName"

    RAsex        DECsec      Radius    X   Y   region_type  color   Text_String


% make_circles_bold.py set.1 > my_markers.reg
% cat my_markers.reg | xpaset ds9 regions -format ds9
Hence, we see that this is a good routine to create circle regions with sizes
that are scaled to, for example, magitude. Ecah line in the input file specifies
a unique circle radius.
Using an extra.quantity file
There are often many columns in a cdfp file. The header line will show what is
present in a given *.cdfp. It is sometimes desirable to add the values of these
columns when labeling points in a region file. If you create a file named
"extra.quantities" that conatins the name of your desired quantity (like
"V" or "magR2", or "Blue") then the quantity will be included follwing the
point name in the text label. This is used in creating the V and magR2 region sets in the
usno_look script. Such region files are easy to build and handy to have around.
If I plot with "V" option I get scaled circle sizes. Here is
how I did it.
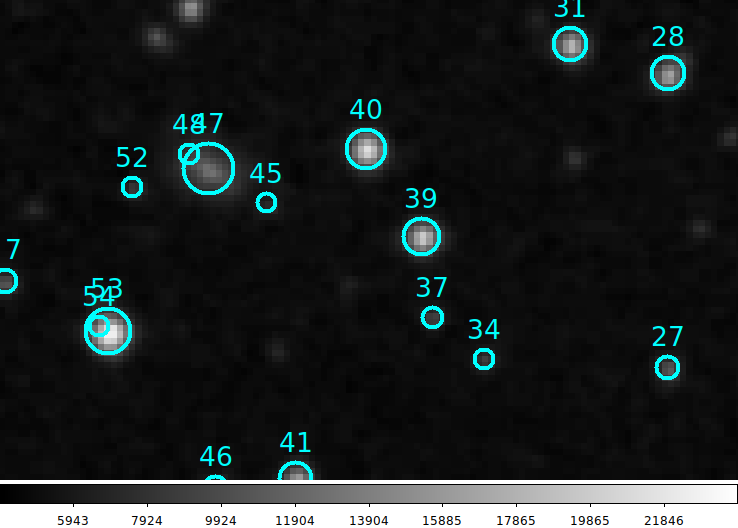 |
By using a radius=-5.0 values I was able to turn off the portion of
the aperture title builder that adds the magnitude value. Because the
magnitude specified in the "extra.quantity" file was "magR2", we still get
the circle sizes that are scaled to reflect the magnitude of each star.
% cdfp2reg.sh dss_RA19c22c47p570DEC+53c20c40p33_297_usno_all.cdfp -5.0 cyan any any
|
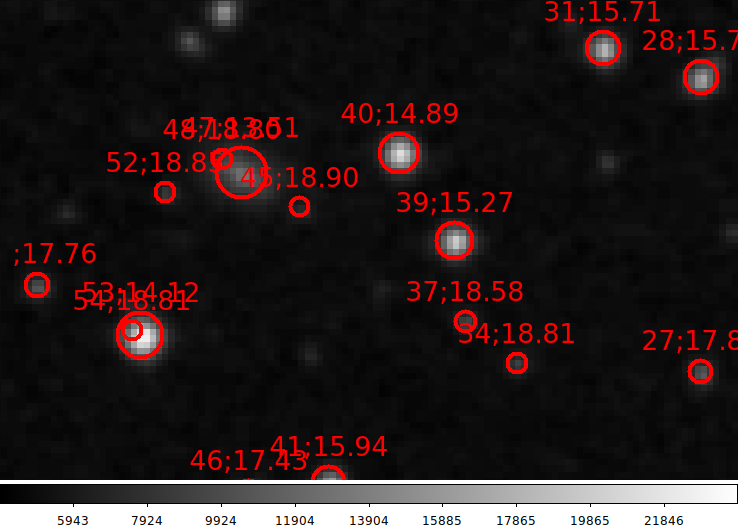 |
By using a radius=+5.0 values I was able to get scaled circle sizes AND the
magnitudes listed in each aperture title.
Because the
magnitude specified in the "extra.quantity" file was "magR2", we get
the circle sizes that are scaled to reflect the magnitude of each star.
% cdfp2reg.sh dss_RA19c22c47p570DEC+53c20c40p33_297_usno_all.cdfp +5.0 red any any
|
April 2020 Addition: I added the
ability to use the NumPix value (from cdfp files made with with
image_catalogs) to generate radius
value in pixel units. For this to work you must have generated the file
named "Plate.Scale" that gives the image plate scale. An example of using
this feature is in photom2_prep.
Back to SCO CODES page