Star sizes on DSS images
I needed a way to scale circle size to approximate magnitudes. Here is
how I did it.
 |
|
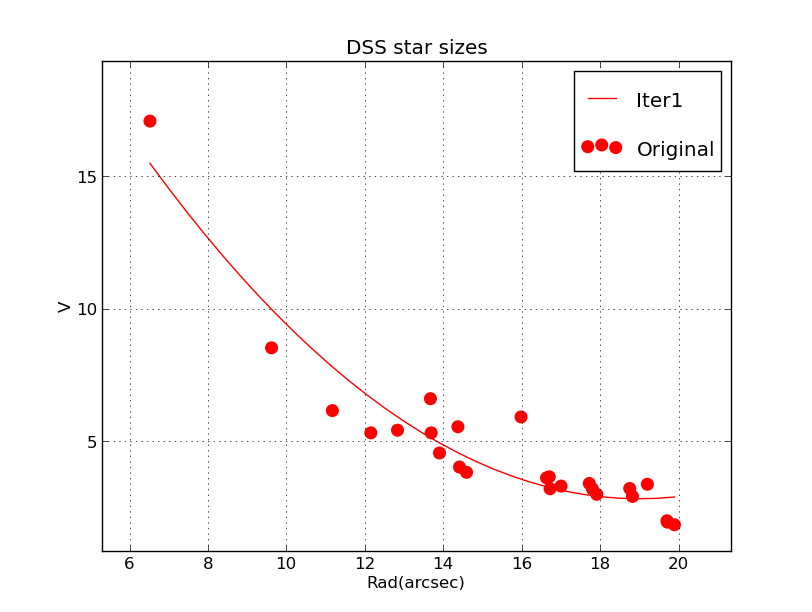
Relation between star V magnitude and radius in arcseconds on DSS images. Data
were taken from 3 different DSS fields.
|
A rough relatio to predict star sizes in arcsec based on V mag (for DSS)

Work done in:  /home/sco/work_2017/n6946_R/T1/n7790/S

Usage: usno_look 08:13:15.10 +45:59:29.0 5.0 15.0 1 JustText
arg1 - Ra J2000 in sexigecimal
arg2 - Dec J2000 in sexigecimal
arg3 - search Radius in arcmin
arg4 - faint V magnitude limit
arg5 - ds9 frame to display in
arg6 - overplot code (S,G,SG,JustText,magR2,V)

NGC7790   23:58:24.0 +61:12:30.0
To get a map:
usno_look 23:58:24.0 +61:12:30.0 8.0 18.0 1 V

% image_ps dss.fits
1.00800073 0.00000957

B.reg = regions saved in image units

To get blue stars where I have sized the circles
stored in keep_1
% ds9regget.sh B.reg circle blue
   690.19     73.84      3.19   circle     blue       {2;17.80}.....................
   624.56     24.56      3.30   circle     blue       {7;17.00}.....................
   858.38    248.49      3.65   circle     blue       {71;16.70}....................
   851.59    221.61      2.99   circle     blue       {72;17.91}....................
   829.25    243.86      3.20   circle     blue       {80;16.72}....................
   801.49    235.79      5.54   circle     blue       {99;14.37}....................
   634.33    418.30      5.41   circle     blue       {219;12.83}...................
   583.89    414.87      5.31   circle     blue       {262;13.69}...................
   580.80    497.30      8.52   circle     blue       {875;9.62}....................
   427.28    567.28      3.61   circle     blue       {1017;16.63}..................
   275.70    698.96      3.40   circle     blue       {1143;17.72}..................


To get brighter stars (and fainter)
76 00:20:05.20 +48:51:55.00 2000.00 +00.005 -00.017 6.52   1561 #  A0V s   BD+48   79  RV -00
usno_look 00:20:05.20 +48:51:55.00 5.0 15.0 1 V
Stored in keep_2
% ds9regget.sh B.reg circle blue
   550.60    225.15      3.82   circle     blue       {1;14.59}.....................
   422.74    200.64      4.02   circle     blue       {5;14.41}.....................
   354.87    391.52      4.55   circle     blue       {7;13.90}.....................
   192.92    138.85      6.15   circle     blue       {21;11.17}....................
    88.92    170.21      5.31   circle     blue       {28;12.15}....................
   298.00    298.77     17.08   circle     blue       {0;6.52}......................

To get fainter stars
% usno_look 08:30:0.00 +48:00:00.0 5.0 20.0 1 V
put in keep_3
% ds9regget.sh B.reg circle blue
   218.02     73.49      1.99   circle     blue       {49;19.70}....................
   481.21    302.36      5.91   circle     blue       {78;15.98}....................
   421.00    404.50      1.94   circle     blue       {85;19.71}....................
   296.67    307.83      1.84   circle     blue       {98;19.89}....................
   216.49    340.10      3.21   circle     blue       {108;18.75}...................
   143.48    463.97      2.91   circle     blue       {113;18.82}...................
    99.66    498.17      3.37   circle     blue       {116;19.20}...................
    91.33    430.76      6.60   circle     blue       {117;13.67}...................


++++++++++++++++++++++++
So, I make file manually:
# data
   690.19     73.84      3.19   circle     blue       17.80
   624.56     24.56      3.30   circle     blue       17.00
   858.38    248.49      3.65   circle     blue       16.70
   851.59    221.61      2.99   circle     blue       17.91
   829.25    243.86      3.20   circle     blue       16.72
   801.49    235.79      5.54   circle     blue       14.37
   634.33    418.30      5.41   circle     blue       12.83
   583.89    414.87      5.31   circle     blue       13.69
   580.80    497.30      8.52   circle     blue       9.62
   427.28    567.28      3.61   circle     blue       16.63
   275.70    698.96      3.40   circle     blue       17.72
   550.60    225.15      3.82   circle     blue       14.59
   422.74    200.64      4.02   circle     blue       14.41
   354.87    391.52      4.55   circle     blue       13.90
   192.92    138.85      6.15   circle     blue       11.17
    88.92    170.21      5.31   circle     blue       12.15
   298.00    298.77     17.08   circle     blue       6.52
   218.02     73.49      1.99   circle     blue       19.70
   481.21    302.36      5.91   circle     blue       15.98
   421.00    404.50      1.94   circle     blue       19.71
   296.67    307.83      1.84   circle     blue       19.89
   216.49    340.10      3.21   circle     blue       18.75
   143.48    463.97      2.91   circle     blue       18.82
    99.66    498.17      3.37   circle     blue       19.20
    91.33    430.76      6.60   circle     blue       13.67

I put this into: Table1.dat
I want to plot     col 6 on X     col 3 on Y
% xyplotter_prep Table1.dat 1

To fit the data:
% curve_runner 1
I fit a parabola (poly3)

My plot is:  Fit1.png
The coefficents are:
% cat poly3.out
   0.32194332123E+02     0.30000000000E+01       a1
  -0.30936033726E+01     0.30000000000E+01       a2
   0.81455871463E-01     0.30000000000E+01       a3

Rad =  a1 + a2*V + a3*V^2
Back to SCO CODES page