Dec2018 Version Trouble Notes
Last updated: Dec10,2018
SOLUTION (Dec11,2018):
In my versions that ran under 2.6.6 and 2.7.4, I could pass
lists of character strings to the "ax.plot(x,y,pstring)" call. It
seems this does not work in 2.7.9, and Sergey suggested that I use
the float function on the infup strings when reading the X,Y values.
This seemed to fixed up the problem. I now have a version of
icurs1.py that works on my old and new python versions. Hence, I
can use one code on scohome, buckaroo, and mcs. I list the source code
fr this new working version at the end of this doc.
I have a matplotlib routine that that I use to interactively plot a set
of XY data points, identify coordinates in the plot, and return a list of the
X,Y positions and character keys usede to record them. This capabilit is extremely
useful for identifying bad points or for identifying a part of parameter space fpr
data fitting, etc....
In Dec2018 I hit a snag in running this code on mcs (both throught my own sco
account and through the astronomer account). In the four examples below I use
4 different accounts on 3 machines. The first two machines are running python
2.8.4 and 2.6.6 versions (old) and the code runs. The last two examples are
from two accounts on mcs that are using python 2.7.7 and these DO NOT run
properly. Namely, the data points are not plotted cirrectly and the cursor
does not report the correct X,Y values. The XY points in the input file are:
% cat xy.in
  1.00000	  1.10000
  3.25000	  3.57500
  5.50000	  8.75              # here is an outlier point
  7.75000	  8.52500
  10.00000	  11.00000

Tun the code I use:
% python icurs1.py
My questions are:
- How do I determine which routine(s) are failing when running python 2.7.7.
- How do I get source code examples for a specific version (i.e python 2.7.7)?
- Is there a way I can update so that a modified code will also run in all 4 versions?
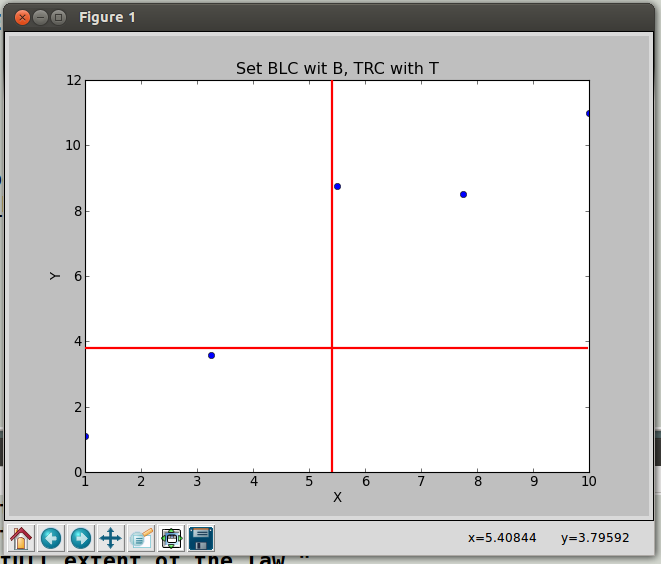 |
The data set plotted on scohome (my home desktop machine running Ubuntu 13.04).
When I run on scohome:
% python
Python 2.7.4 (default, Sep 26 2013, 03:20:26)
[GCC 4.7.3] on linux2
Type "help", "copyright", "credits" or "license" for more information.
>>> import numpy as np
>>> import matplotlib.pyplot as plt
>>> from matplotlib.widgets import Cursor
Important points to note here are:
- The 5 points are correctly positioned, including the outlier
point at X,Y=5.5,8.75.
- The X,Y values are reporting the cursor position in the lower-right
corner of the show() gui.
- The correct X,Y values and keystroke values are reported.
|
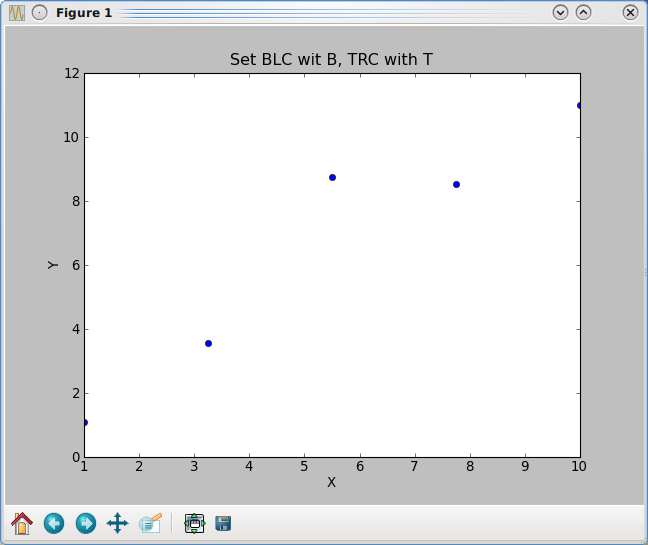 |
The data set plotted on buckaroo (my office desktop machine running RedHat6).
buck% python
Python 2.6.6 (r266:84292, Nov 21 2013, 10:50:32)
[GCC 4.4.7 20120313 (Red Hat 4.4.7-4)] on linux2
Type "help", "copyright", "credits" or "license" for more information.
>>> import numpy as np
>>> import matplotlib.pyplot as plt
>>> from matplotlib.widgets import Cursor
Important points to note here are:
- The 5 points are correctly positioned, including the outlier
point at X,Y=5.5,8.75.
- The X,Y values are reporting the cursor position in the lower-right
corner of the show() gui.
- The correct X,Y values and keystroke values are reported.
Note that the style of the show() gui is slightly different than the
scohome verion above, but the reported positions and key-stroke values
are correct.
|
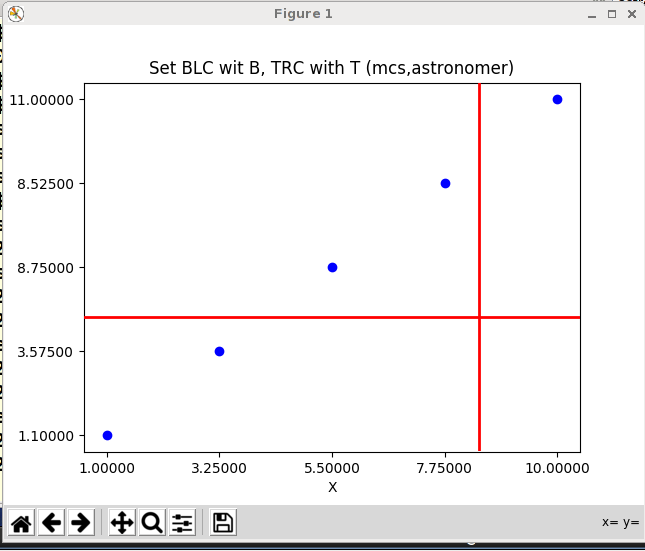 |
The data set plotted on mcs whille running in the astronomer account.
[astronomer@mcs ~]$ python
Python 2.7.9 (default, Jul 16 2015, 22:38:09)
[GCC 4.4.7 20120313 (Red Hat 4.4.7-11)] on linux2
Type "help", "copyright", "credits" or "license" for more information.
>>> import numpy as np
>>> import matplotlib.pyplot as plt
>>> from matplotlib.widgets import Cursor
Important points to note here are:
- Four of the points are correctly positioned, but the outlier
point at X,Y=5.5,8.75 is NOT.
- The X,Y values are NOT reporting the cursor position in the lower-right
corner of the show() gui.
- Incorrect X,Y values are returned, but correct keystroke values are reported.
Note that the style of the show() gui is slightly different than the
scohome verion above, but the reported positions and key-stroke values
are correct.
|
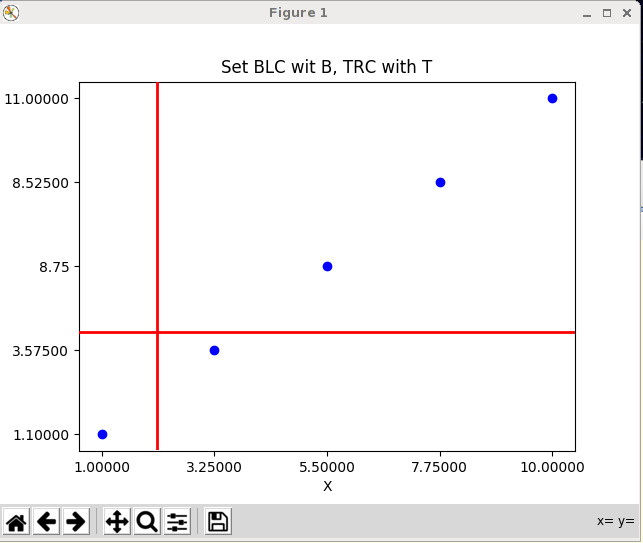 |
The data set plotted on mcs whille running in the sco account.
Note: I had to ssh from astronomer
[sco@mcs ~/tmp]$ python
Python 2.7.9 (default, Jul 16 2015, 22:38:09)
[GCC 4.4.7 20120313 (Red Hat 4.4.7-11)] on linux2
Type "help", "copyright", "credits" or "license" for more information.
>>> import numpy as np
>>> import matplotlib.pyplot as plt
>>> from matplotlib.widgets import Cursor
Important points to note here are:
- Four of the points are correctly positioned, but the outlier
point at X,Y=5.5,8.75 is NOT.
- The X,Y values are NOT reporting the cursor position in the lower-right
corner of the show() gui.
- Incorrect X,Y values are returned, but correct keystroke values are reported.
Note that the style of the show() gui is slightly different than the
scohome verion above, but the reported positions and key-stroke values
are correct.
|
Finally, for completeness I include the source code used in all four of the above cases.
#!/usr/bin/env python
''' Plot data points read from file xy.in  and allow user
    to identify X,Y values using the mouse '''

import numpy as np
import matplotlib.pyplot as plt
from matplotlib.widgets import Cursor

# Define the function that will store X,Y values in the
# the list coords[] when mouse clicks are detected.
def onclick(event):
    global ix, iy, ib
#    ix, iy, ib = event.xdata, event.ydata, event.button
    ix, iy, ib = event.xdata, event.ydata, event.key
    print 'x = %d, y = %d b=%s ' % (ix, iy, ib)
    print 'I have x,y,button'
    global coords
    coords.append((ix, iy, ib))
    if len(coords) == 100:
        fig.canvas.mpl_disconnect(cid)
    return coords

def onclick2(event):
    print('%s click: button=%d, x=%d, y=%d, xdata=%f, ydata=%f' %
          ('double' if event.dblclick else 'single', event.button,
           event.x, event.y, event.xdata, event.ydata))

#=========================================================
# Open the file (read-only) to read axis info
# and list of files with X,Y sets
g = open('xy.labels', 'r')
# Read axis label info
header1 = g.readline()
header2 = g.readline()
header3 = g.readline()
label_main  = header1.rstrip()
label_xaxis = header2.rstrip()
label_yaxis = header3.rstrip()
g.close()
#=========================================================


# read the the X,Y plot data from file xy.in for reading
infile = open('xy.in','r')
x = []
y = []
for lines in infile:
 linefull = lines.split()
 x.append( linefull[0] )
 y.append( linefull[1] )

# Plot the data
fig = plt.figure()
ax = fig.add_subplot(111)

pstring="bo"

ax.plot(x,y,pstring)

# Make a red, two-line cursor
cursor = Cursor(ax, useblit=True, color='red', linewidth=2)

# Set up the coords list for storing X,Y at click positions
coords = []

cid = fig.canvas.mpl_connect('button_press_event', onclick)
cid2 = fig.canvas.mpl_connect('key_press_event', onclick)

# label the axes
plt.title(label_main)
plt.xlabel(label_xaxis)
plt.ylabel(label_yaxis)

plt.show()

any = raw_input("Enter anything to continue: ")

# Coords is a list of lists
print "I will print coords here: "
type(coords)
nc=len(coords)
print "Number of x,y sets (mouse clicks) collected in coords = %d" % (nc)

# Open a file for saving header lines
fcurs = open('cursor.lines', 'w')

print "\nHere are the stored mouse click events:"
for i in range(0,nc):
  s = coords[i]
#  print "x,y,key:  %9.3f %9.3f %s"  % (s[0],s[1],s[2])
  fcurs.write("   %9.3f %9.3f %s \n"  % (s[0],s[1],s[2]) )
Below is the revised code that works on mcs.
#!/usr/bin/env python
''' Plot data points read from file xy.in  and allow user
    to identify X,Y values using the mouse '''

import numpy as np
import matplotlib.pyplot as plt
from matplotlib.widgets import Cursor

# Define the function that will store X,Y values in the
# the list coords[] when mouse clicks are detected.
def onclick(event):
    global ix, iy, ib
#    ix, iy, ib = event.xdata, event.ydata, event.button
    ix, iy, ib = event.xdata, event.ydata, event.key
    print 'x = %d, y = %d b=%s ' % (ix, iy, ib)
    print 'I have x,y,button'
    global coords
    coords.append((ix, iy, ib))
    if len(coords) == 100:
        fig.canvas.mpl_disconnect(cid)
    return coords

def onclick2(event):
    print('%s click: button=%d, x=%d, y=%d, xdata=%f, ydata=%f' %
          ('double' if event.dblclick else 'single', event.button,
           event.x, event.y, event.xdata, event.ydata))

#=========================================================
# Open the file (read-only) to read axis info
# and list of files with X,Y sets
g = open('xy.labels', 'r')
# Read axis label info
header1 = g.readline()
header2 = g.readline()
header3 = g.readline()
label_main  = header1.rstrip()
label_xaxis = header2.rstrip()
label_yaxis = header3.rstrip()
g.close()
#=========================================================


# read the the X,Y plot data from file xy.in for reading
infile = open('xy.in','r')
x = []
y = []
for lines in infile:
 linefull = lines.split()
#x.append( linefull[0] )
#y.append( linefull[1] )
 x.append( float(linefull[0]) )
 y.append( float(linefull[1]) )

# Plot the data
fig = plt.figure()
ax = fig.add_subplot(111)

#pstring="bo"
#:ax.plot(x,y,pstring)
plt.scatter(x, y, marker="o", color="r", facecolors="b", edgecolors="r", s=70 )

# Make a red, two-line cursor
cursor = Cursor(ax, useblit=True, color='red', linewidth=2)

# Set up the coords list for storing X,Y at click positions
coords = []

cid = fig.canvas.mpl_connect('button_press_event', onclick)
cid2 = fig.canvas.mpl_connect('key_press_event', onclick)
#Zcid = fig.canvas.mpl_connect('button_press_event', onclick2)

# label the axes
plt.title(label_main)
plt.xlabel(label_xaxis)
plt.ylabel(label_yaxis)

plt.show()

any = raw_input("Enter anything to continue: ")

# Coords is a list of lists
print "I will print coords here: "
type(coords)
nc=len(coords)
print "Number of x,y sets (mouse clicks) collected in coords = %d" % (nc)

# Open a file for saving header lines
fcurs = open('cursor.lines', 'w')

print "\nHere are the stored mouse click events:"
for i in range(0,nc):
  s = coords[i]
#  print "x,y,key:  %9.3f %9.3f %s"  % (s[0],s[1],s[2])
  fcurs.write("   %9.3f %9.3f %s \n"  % (s[0],s[1],s[2]) )
Back to calling page