20190714 Offset Data Analysis
Last Updated: July 16, 2019
A set of acm,gc1,gc2 images were obtained at 4 sky positions on 20190714. After
a lot of work, the data were determined to be defective. As shown in the figure
below, the gc imags set were found to produced dystematically drifting centroids.
This was due to the fat that a very short acm integration time (1 sec) was used in
concert with a very long cycle time (10 sec). hence, the telescope was not really
fully guiding. In an effort to researh these problems, I developed an independent
reduction method that uses only the PAS centroids. The results were little changed.
The new codes:
pas_XY_offsets.sh  == determine image offsets PAS X,Y centroids
Usage: pas_XY_offsets.sh list.1 list.2 N
arg1 - list of set1 PAS images
arg2 - list of set2 PAS images
arg3 - radius in pixels for the xy1,2.reg files
arg4 - run in verbose/debug mode (Y/N)

acm_offset: Given the acm offset (and error) in pixels compute the offset and
            error in arcseconds (for feeding to gcps.sh).
Usage: acm_offset 40.9708 2.1634
arg1 - offset in pixels
arg2 - mean error in pixels
arg3 - run in debug (Y/N)

gcps.sh  == compute gc plate scale when you know the acm offset and error in arcseconds
            and the gc offset in pixels
Usage: gcps Y
arg1 - run in debug mode
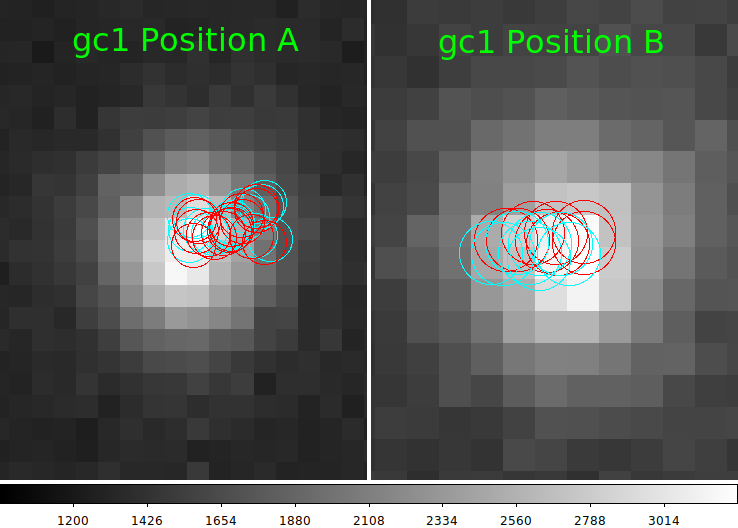
A figure that shows and example of centroid drift in the gc1 field
is shown below.
 |
|
This shows the first gc1 pic in the first position (A) and the second position (B). The sky separation between
A and B was about 10". There were 16 images in the A group and 8 images in the B group. They span a time
from 105451.3 UT to 105610.0 UT (to match the interval for the acm image set). Hence, the total time
interval for when the images were taken was about 80 seconds.
The red circles in each image of the figure show the X,Y centroids computed with own code. The cyan circles
are the PAS header values. These are the tcs metrology values (although in these experiments the acm was
always guiding). My eye tells me there is no real difference, and the X,Y statistics confirm this. The problem
should be quite evident: the image centers (the circles) are moving fairly steadily over the 80 seconds in
which data were collected. The size of this drift is about 5 pixels , or around 1.0". This is a a very
large chnage for 80 seconds of data taking!
|
The software steps of how this reduction was made are recorded below.
For any camer/point position:
I store the images lists in:    /home/sco/GC_Plate_Scales/2090814/gc2/S

 PointA
  In /home/sco/GC_Plate_Scales/gc2/gc2_A
   ds9_imstats_fitslist ../S/list.gc2_A FixedRegions N

 PointB
  In /home/sco/GC_Plate_Scales/gc2/gc1_B                       #  17 images
   ds9_imstats_fitslist ./S/list.gc2_B FixedRegions N

  In /home/sco/GC_Plate_Scales/gc2/
     table_XY_offsets.sh ./gc2_A/XYmean ./gc2_B/XYmean xmean ymean xme yme N
  *** Record the offsets in pixels

  NOTE: use acm_offset to get offset in arcseconds in case of acm image

  When all offsets are computed, use gcps.sh to compute plate scale and error.
Compiling the acm offsets
I have 2 stars measured on each acm image.
Position Pair    Mean Offset (pixels)   Mean Offset (arcsec)
   A-B            40.9708 -+2.1634       11.0662 -+0.5843
   A-C            26.8522 -+0.2671        7.2528 -+0.0721
   A-D            30.0524 -+0.7796        8.1172 -+0.2106
   B-C            30.1791 -+1.6639        8.1514 -+0.4494
   B-D            29.5451 -+1.3124        7.9801 -+0.3545
   C-D            41.4644 -+0.2963        11.1995 -+0.0800
Compiling the gc1 offsets
I have 1 star measured on each gc1 image.
Position Pair    Mean Offset (pixels)   Derived PS (arcsec/pix)
   A-B               52.6519 -+0.3        0.210177 -+ 0.011097
   A-C               36.9806 -+0.3        0.196124 -+ 0.001950
   A-D               41.4473 -+0.3        0.195844 -+ 0.005081
   B-C               38.8949 -+0.3        0.209575 -+ 0.011554
   B-D               38.6136 -+0.3        0.206666 -+ 0.009181
   C-D               57.5198 -+0.3        0.194707 -+ 0.001391
  Averaging all gc1 ps values =   0.20218 -+ 0.00301 "/pix
Compiling the gc2 offsets
I have 1 star measured on each gc2 image.
Position Pair    Mean Offset (pixels)   Derived PS (arcsec/pix)
   A-B            52.2044 -+0.3         0.211978 -+0.011193
   A-C            37.2893 -+0.3         0.194501 -+0.001934
   A-D            42.7345 -+0.3         0.189945 -+0.004928
   B-C            38.4516 -+0.3         0.211991 -+0.011687
   B-D            40.4684 -+0.3         0.197193 -+0.008760
   C-D            59.8532 -+0.3         0.187116 -+0.008760
  Averaging all gc2 ps values =   0.19879 -+ 0.00441 "/pix
Using the PAS coordinates
The PAS headers have X,Y centroids for obe star per image. As a check I
compare the PAS and ds9_imstats coordinates on a typical acm image.
The test image was:   /media/sco/DataDisk1/sco/AD/HET_work/acm_nights/20190714/acm/20190714T105740.0_acm_sci.fits

Results from ds9_imstats:
Col01 = X pixels (aperture X center)
Col02 = Y pixels (aperture Y center)
Col03 = X center, pixels (intensity weighted centroid)
Col04 = Y center, pixels (intensity weighted centroid)
Col05 = magnitude (assuming zp=30)
Col06 = Average value per pixel in aperture
Col07 = Average value per pixel in annulus
Col08 = number of pixels in aperture
Col09 = Peak pixel value (no bkg-sub, image ADU)
Col10 = marker code (1=circle,2=box,3=ellipse)
   698.67    233.11    700.04    232.03  14.911  2392.251  1388.184     1081.0   28485.00   1
                       ******    ******

% gethead 20190714T105740.0_acm_sci.fits OBICX OBICY
700.131653 232.016846

Hence, the final comparions:
   PAS            700.13  232.02
   ds9_imstats    700.04  232.03
The differences are negligable. The ds9_imstats approach allows me to use multiple
star per image (if they are present) and the PAS values may be superior in the
case of gc1,gc2 where care has been taken to incorporate a mask to eliminate the
effects of the inactive image pixels.
Back to calling page