Bias and Dark Frames
My first question regarding the images listed in fits_review.pass0 (fits_review.table) is
this: where are the bias and dark frames?
From Matt's notes
Truss Temp = 12.9
Using /home/mcs/astronomer/script11 to take bias and dark frames for
ACQ, Guider1 and Guider2.
40 frames of 0.01 seconds, 40 5 second, 40 10 second and 40 20 second frames in that order..

ACAM bias frames: 20171231T022335.3 -> 20171231T022647.8_acm_sci.fits
5 second dark frames:   20171231T022658.9_acm_sci.fits -> 20171231T023326.6_acm_sci.fits
10 second dark frames:  20171231T023342.8_acm_sci.fits -> 20171231T024325.4_acm_sci.fits
20 second dark frames: 20171231T024351.5_acm_sci.fits -> 20171231T030004.0_acm_sci.fits

I went through my big list (list.all) and found these corresponding image numbers:
ACAM bias        20171231T022335.3_acm_sci.fits -> 20171231T022647.8_acm_sci.fits      3  42
5 second dark    20171231T022658.9_acm_sci.fits -> 20171231T023326.6_acm_sci.fits     43  82
10 second dark   20171231T023342.8_acm_sci.fits -> 20171231T024325.4_acm_sci.fits     83 122
20 second dark   20171231T024351.5_acm_sci.fits -> 20171231T030004.0_acm_sci.fits    123 162

# In red0  (/home/sco/HET_reds/20171231/red0)
# I run fits_review to get a basic file summarizing the images
% fits_review list.all N
To do 544 images in this step took about 4 min
% fits_review_table N

I can make useful plots:
xyplotter_auto fits_review hours signal  1
xyplotter_auto fits_review imgnum signal 1

# TIP:  To get smaller points in the plot:
1) I edit the point size valuse in the file:  List.1
   fits_review.table 1 14 0 0   point  r o 70 Original
   I change to:
   fits_review.table 1 14 0 0   point  r o 20 Original
2) I replot the figure with:
    xyplotter List.1 Axes.1
Note that it is mportant to use "signal" and the bias and flux values are
not valid (as of Dec2017) because the initial coluns of the acm are not a
bias overscan area. Below is a plot I made that shows our bas and 3 different
dark images.
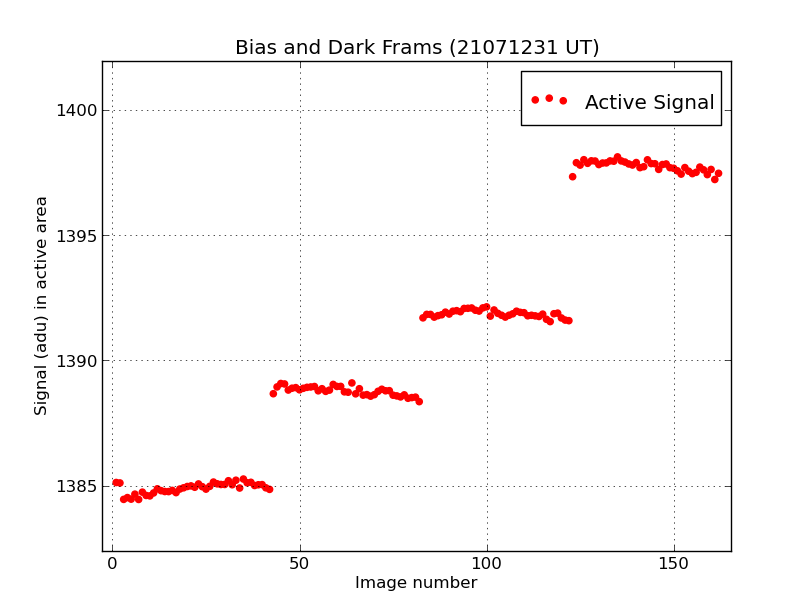 |
The bias and dark sets taken by MS on 20171231. These data points were collected
with a run of fits_review and plotted with xyplotter_auto. The image number
in plotted on the X axizs and the mean signgal in the active are (defined to
be [60:710,60:710]) is plotted on the Y axis. Using the show() tool of matplotlib
to view this plot enabled me to zoom into each data set and confirm the line
numbers for the images in list.all:
Image Type         Start Image                            End Image                  line numbers
-------------    ------------------------------    ------------------------------    ------------
ACAM bias        20171231T022335.3_acm_sci.fits    20171231T022647.8_acm_sci.fits       3  42
5 second dark    20171231T022658.9_acm_sci.fits    20171231T023326.6_acm_sci.fits      43  82
10 second dark   20171231T023342.8_acm_sci.fits    20171231T024325.4_acm_sci.fits      83 122
20 second dark   20171231T024351.5_acm_sci.fits    20171231T030004.0_acm_sci.fits     123 162
|
Bias and Dark images from other nights.
After the above data (20171231) were taken, the temperature dropped significantly and JC
retook he bias and dark images to inverstigate systematic variation with temperature.
Notes from JC's log:
a suite of 41 acam biases
and 5s, 10s, 20s darks
(see /home/mcs/astronomer/acam??.list)

I retrieve the acam??.list files. They appear to be (mcs) listings of the
bias and dark sets:
[sco@mcs ~]$ ls /home/mcs/astronomer/acam??.list
/home/mcs/astronomer/acam00.list  /home/mcs/astronomer/acam05.list  /home/mcs/astronomer/acam10.list  /home/mcs/astronomer/acam20.list

I build this list from those files:
acam00.list  20180101T072624.8_acm_sci.fits  20180101T072940.2_acm_sci.fits
acam05.list  20180101T072956.3_acm_sci.fits  20180101T073631.7_acm_sci.fits
acam10.list  20180101T073652.8_acm_sci.fits  20180101T074648.5_acm_sci.fits
acam20.list  20180101T074719.6_acm_sci.fits  20180101T080355.7_acm_sci.fits

# The raw images reside here:
  /home/sco/HET_work/acm_nights/201180101/
# I take a first pass at the data in:
   /home/sco/HET_reds/20180101/red0

# Build the file listing all images
ls -1 /home/sco/HET_work/acm_nights/20180101/acm/201*.fits > list.all .
This is a list of 164 images

# I run fits_review to get a basic file summarizing the images
% fits_review list.all N
To process this list of 164 images took about 1 minute
% fits_review_table N

I can make useful plots:
xyplotter_auto fits_review hours signal  1
xyplotter_auto fits_review imgnum signal 1

As above, I edited the List.1 and Axes.1 files to make a few manual
changes to the point types and plot labeling, then I replotted with:
  xyplotter List.1 Axes.1

NOTE: Later MS suggested I could find temp data from:
http://weather.as.utexas.edu/cgi-bin/weather/het-weather-query.pl

A typical time from this night (for the BD) set = 20180101  07:27:23.4
This site is difficult to use and gives average Temp (in Farenheit) on Mt. Locke, but
I found for the BD time   Temp = 19.1 deg F = -7.2 C

This does not jive at all with the temps reported for Mt. Fowlkes that night.
I am sticking with 8 deg C (Justen's stated value)
Below is the plot I get for these 20180101 images.
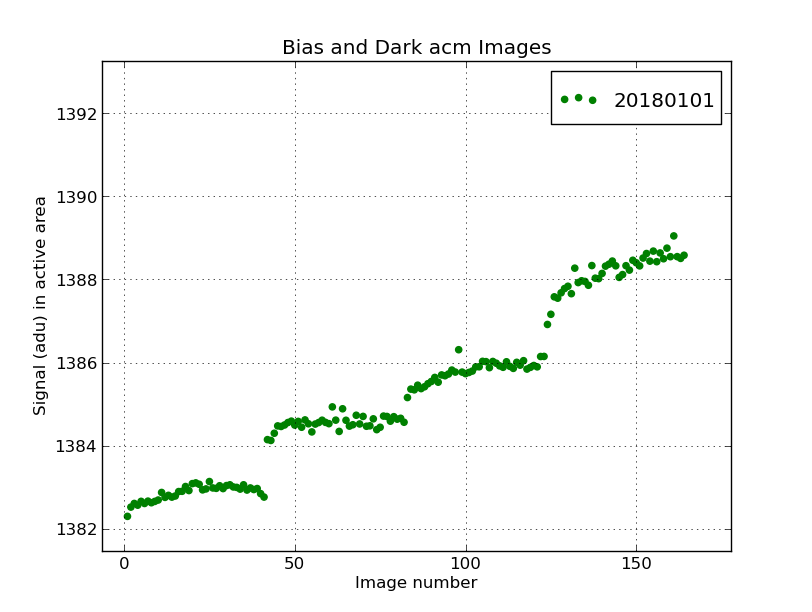 |
The bias and darks sets taken by JC on 20180101. Here are image names and
numbers for the images in list.all for each set.
Image Type         Start Image                            End Image                  line numbers
-------------    ------------------------------    ------------------------------    ------------
ACAM bias        20180101T072624.8_acm_sci.fits    20180101T072940.2_acm_sci.fits       1  41
5 second dark    20180101T072956.3_acm_sci.fits    20180101T073631.7_acm_sci.fits      42  82
10 second dark   20180101T073652.8_acm_sci.fits    20180101T074648.5_acm_sci.fits      83 123
20 second dark   20180101T074719.6_acm_sci.fits    20180101T080355.7_acm_sci.fits     124 164
|
JC took another set of bias+dark data on 20180102. The BD data data were comprised again of about 160
images, but a lot of on-sky observing was done on this night. The total number of images was over 600.
Hence, I decided to build a list.BD in the red0 directory: one that lists only the bias and dark image
sets. This just keeps the files sizes and processing times down.
Notes from JC's log:
do the acam dark suite
yesterday was /h/m/a/acam*.20180101
tonight will be /h/m/a/acam*20180102
Truss Temp Avg: 9.0C,  Air Temp Avg: 8.8C,  Mirror Temp Avg: 7.8C,  Tracker Temp Avg: 6.6C

Table of data (line numbers refer to the file list.BD)

Image Type         Start Image                            End Image                  line numbers
-------------    ------------------------------    ------------------------------    ------------
ACAM bias        20180102T073753.0_acm_sci.fits    20180102T074113.6_acm_sci.fits
5 second dark    20180102T074129.9_acm_sci.fits    20180102T074810.5_acm_sci.fits
10 second dark   20180102T075522.8_acm_sci.fits    20180102T080525.2_acm_sci.fits
20 second dark   20180102T080556.8_acm_sci.fits    20180102T082239.4_acm_sci.fits

# Build the file listing all images
ls -1 /home/sco/HET_work/acm_nights/20180102/acm/201*.fits > list.all .
list.all has 684 images
*** I copy to list.BD and edit to include only the bias and dark (BD) images

% fits_review list.BD N
% fits_review_table N
xyplotter_auto fits_review imgnum signal 1
I process this image set in the manner outlined above. Instead of just plotting this single
set (like above) I will add this data set to the combined plot describe below.
How can I combine my plots?
Viewing the two plots above shows me that some systematic variation is happening between
the two nights.
I did this work originally in:  /home/sco/BD_acm_plots

For each plot, the important files used are:
Axes.1
List.1
fits_review.table

To make the plot I did:
xyplotter List.1 Axes.1

% mkdir BD_acm_plots
% cd BD_acm_plots
% ls
% cp /home/sco/HET_reds/20180101/red0/Axes.1 .
% cp /home/sco/HET_reds/20180101/red0/List.1 .
% cp /home/sco/HET_reds/20171231/red0/fits_review.table fits_review.table.20171231
% cp /home/sco/HET_reds/20180101/red0/fits_review.table fits_review.table.20180101
% cp /home/sco/HET_reds/20180102/red0/fits_review.table fits_review.table.20180102

Then I changed the lines in the List.1 a little:
  1) I changed the names of the data files (fits_review.table)
  2) I changed the point types (i.e. I changed "g o 20" to "r s 30")
  3) I changed that label value that will be plotted in the legend.

Here are the files I end up with:
% cat List.1
fits_review.table.20171231   1 14 0 0   point    r s 30    20171231 (12.9C)
fits_review.table.20180101   1 14 0 0   point    g o 20    20180101 (8.0C)
fits_review.table.20171231   1 14 0 0   point    b h 30    20180102 (9.0C)
% cat Axes.1
Bias and Dark acm Images
  1.00000 164.00000 Image number
  1382.29860 1389.04570 Signal (adu) in active area
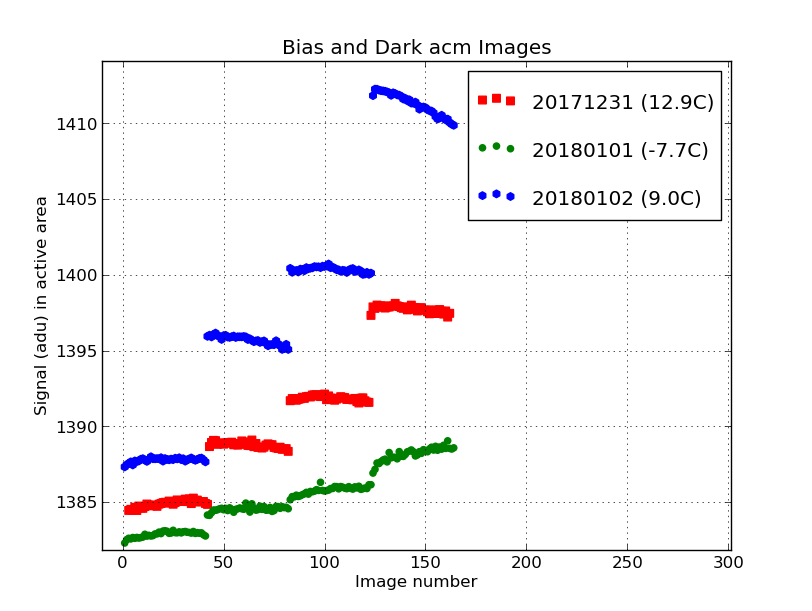 |
The bias and dark sets taken on two different nights. The night of 20171231
was warm (around 12degC) and the next night of 20180101 was colder (around
-7.7degC). For each night we see our 4 data sets in increasing image numbers:
bias, 5 sec dark, 10 sec dark and 20 sec dark. The two important trends I
observe are:
- The "warm set" (red=20171231) points are significantly higher, including the
bias level (1385.0 for 20171231 and 1383.2 for 20180101).
- In the "cold set" (green=20180101) we see a rising trend in each set of images.
I was told the ambient temperature in the dome was rising when these images
were taken, and this may account for this sytematic rise.
These two points are bad news for any of us hopeing for a "universal fixed bias frame"
or even a mean dark count from the acm. Later I added data from 20180102
when the temp was reported to be 9.0C. My claim of trend with Temperature would seem to be
uncertain.
|
Back to calling page