Astro-Mix 1: A VIRUS Display Tool.
- An amalgam of HET rendering tools.
An amalgam of rendering tools.
A combination of python, bash script, and OTW (bash+gfortran) tasks
have been combined to provide a tool for visualizing the VIRUS
components (i.e. IFU and fiber positions) on the sky.
Much of this was developed under Python 2.7, and some problems
were encountered when an mcs install was attempted (mcs is the
HET machine used by resident astronomers for observing). The bottom line
is that the argparse module is not available in Python 2.6
(currently installed on mcs). It is possible to add a 2.6 version
for argparse, and Francesco Montesano has suggested
this document
that describes how to install a 2.6 argparse version.
The goal here has been to provide a versatile tool that allows
the user to easily visualize the HET field on the sky.
Such a tool may be useful during observing, but I
am finding it extremely useful for developing software tools for
VIRUS Astrometry Commissioning.
A local (working) version of this document, can be reached
HERE. As discussed in this plan, the tasks of going from
sky-to-FP and FP-to-sky (FP = focal plane) are complicated slightly
by characteristics of the HET (alt-az mount, partial rho motion, etc..) and
the possibility of nonradial field distortion introduced by the WFC (wide
field corrector). All of these operations will ultimately be handled by
simple command-line calls, but I believe the ability to
visualize the results expected from these tasks will be critical to
our commissioning success.
I am primarily concerned here with the VIRUS IFU properties,
but we can also over-plot a simple North-East legend or
plate-scale legend (as well as parallactic angle direction),
the acquisition camear (ACAM) field, and the guide probe annuli
in the HET focal plane assembly (FPA).
These capabilities will be useful in commissioning and future
general work with the HET. One goal is to make the tool
versatile with respect to the form of the WCS installed in the
header of the astronomical image we are overplotting to. The
tool should be able to use the old-style WCS (CROTA2, CDELT2, etc...)
as well as the more newly adopted CD-matrix form. Finally, we must
be able to make use of the new FITS conventions for XY
distortion correction (SIP = Simple Image Polynomial). All of these
concerns are being addressed in the current tool set.
The figure below demonstrates some of our capabilities as of July 2015.
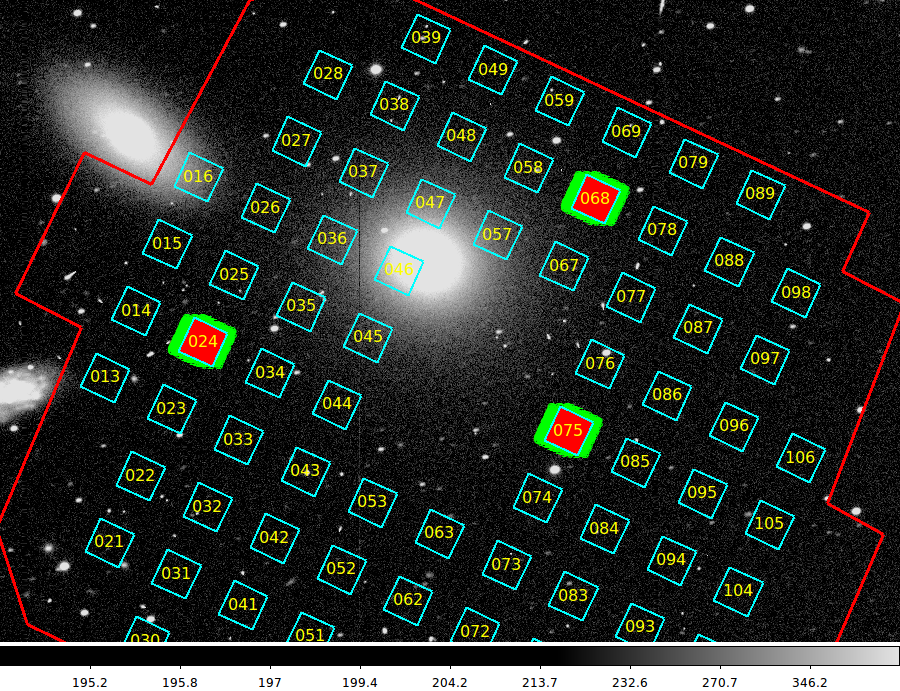 |
The VIRUS IHMP outline, as well as the IFU positions and
some fiber sets were overplotted above on an image (with
FITS WCS) of NGC3379 using the two commands:
virus_ds9 n3379_B.fits 30
virus_mark_all 25.0 1000 900
An explanation of the command strings above is not warranted
now, but is should be note that the virus_ds9 task
simply takes the image name and a dynamic range value for the
scaling (low for linear views close to sky, high for linear- of
log- scaling in the areas of bright sources like galaxies).
In the case above, a simple box-view is used to represent each
IFU, but in the cases of IFUs 068, 024, and 075 we have plotted
and labeled each of the 448 fibers.
|
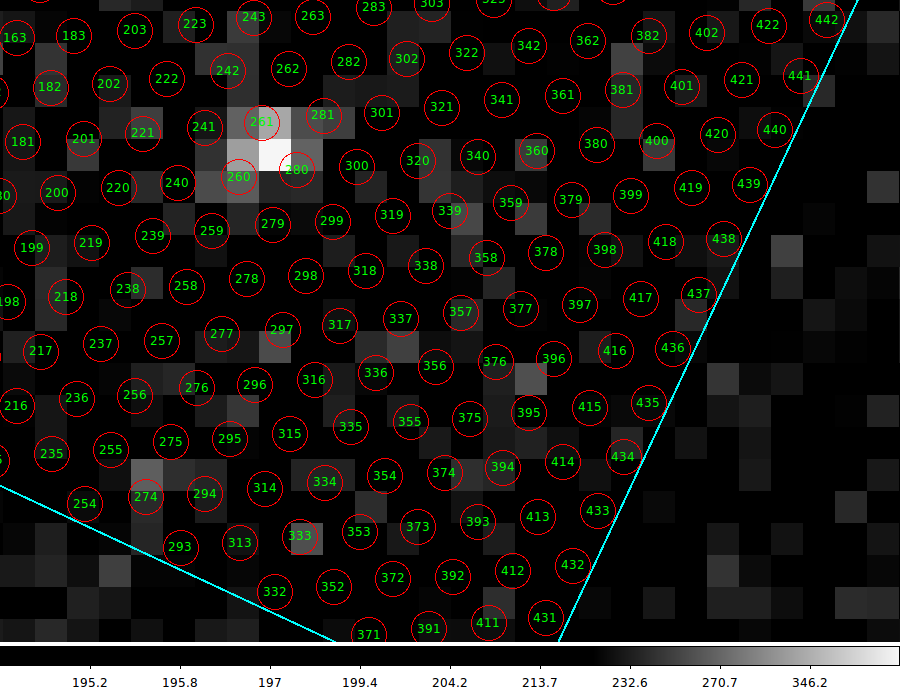
This active ds9 display takes less than 1 second to render, and enables
the user to interactively zoom into areas of interest (as in the figure
below). For reference, it is useful to know that
plotting the labeled fibers for all 78 VIRUS IFUs on this image requires
about 12 seconds. The graphic below was made in this same ds9 run, where
the user has zoomed to a particular IFU to a level that allows the
individual fibers (and their identification numbers) to be viewed easily.
 |
|
Here we have zoomed into a portion of IFU 068. The user can
move through the field and identify fibers that coincide
with sources of interest in the image. As an example, the
bright source above should yield a bright Cure-extracted spectrum
with fiber #261 in IFU068.
|
The envisioned final goal: The examples
above use a WCS-calibrated CCD image from the McDonald PFC taken some
time ago. We'll frequently use DSS or SDSS images for similar
displays. However, by building a paradigm that uses well-established
WCS and rendering approaches, our inputs should eventually
be 2-d images from VIRUS itself. Images from Cure made with
apimage (or "Son of" apimage) will contain the full WCS header
including the SIP distortion terms derived for our VIRUS+WFC+HET system.
back to calling page