Plotting multiple data sets: Bulge+Disk Modesl
AAA
In Oct2018 I revised a lot of the parts of xyplotter_auto to make usage
more versatile and easy. In this example I start with a table file
created with the code bulgedisk.sh.
This code creates surface brightness profiles for a bulge and disk model. In the
example below I show and easy way to plot the individual components and their
summed result. The table file has a base name of BulgeDisk, and the parlab file
contains the parameters names and more detail axis label strings. I often can not
remember the parameter names, so in the example I specify the parameters in X and Y as
"q" and "q". This way we are shown the parameter names and queried for which
ones we want to plot.
% bulgedisk.sh 20.0 100 1000.0 3.0  100.0 10.0 N      # Generate the table file

Build the first plot
% xyplotter_auto BulgeDisk q q 10 N     # plot the bulge data
% xyplotter_auto BulgeDisk r q 10 N     # plot the disk data
% xyplotter_auto BulgeDisk r q 10 N     # plot the bulge+disk data

% cat List.10
BulgeDisk.table 2 7 0 0   line   r - 70 Bulge
BulgeDisk.table 2 8 0 0   line   g - 70 Disk
BulgeDisk.table 2 9 0 0   point  b o 70 Bulge+Disk
% cat Axes.10
Bulge and Disk Model
  0.00000 20.00000 Radius
  0.97870 6.33070 log(Intensity Bulge)

Build the new plot
% xyplotter List.10 Axes.10
Note that in the example above, I used the python show() module to create
a hardcopy of the plot. This is the file named "figure_1.png". In the
next example, we'll see how to modify the appearance of this plot and
how to easily add other data sets.
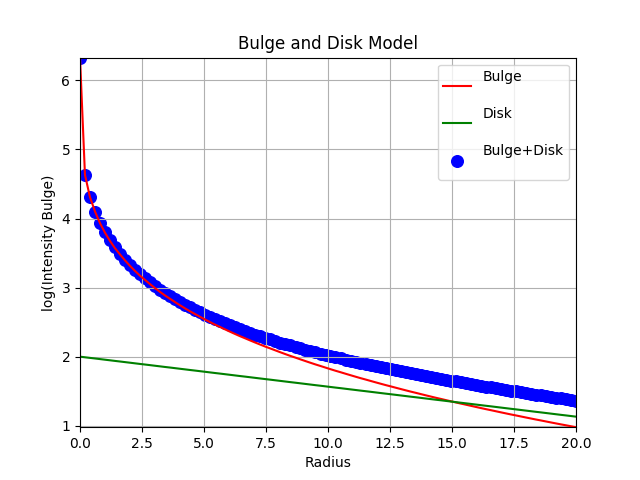 |
The bule, disk, and bulge+disk model values are plotted using a Table file generated
with bulgedisk.sh. The recipe for generating this plot is given in the above text. Basically
I use three calls to xyplotter_auto to plot three different columns of the table file. I could use
another table file in any of the steps if I wanted. The fact that I use the same plot number
(10 in our example here) means that I simply add each set to the List.10 file. There is no need
to edit files. The commands I use to generate and plot the data are below
% bulgedisk.sh 20.0 100 1000.0 3.0  100.0 10.0 N      # Generate the table file
% xyplotter_auto BulgeDisk q q 10 N     # plot the bulge data
% xyplotter_auto BulgeDisk r q 10 N     # plot the disk data
% xyplotter_auto BulgeDisk r q 10 N     # plot the bulge+disk data
% xyplotter List.10 Axes.10
|
Back