Example of polynomial fits
Last update: Nov29,2018
In the early days of xyfitter I was using it to fit polynomials to
marginal distributions. Beacuse the row/column values in such data sets can be
quite large numbers, it is very important to normalize the X data to a
smaller range. Here I show a few files used and command lines for makeing the
plot at the bottom.
xyfitter margdist_sub pixel mean poly7 N
% cat X.normit
180.0 15.0
% cat margdist_sub.parlab
pixel Row Number
mean Mean signal value (adu)
sig Standard devistion (adu)
me Mean error about mean (adu)
Npix Number of pixels
% cat margdist_sub.table
# row averaged marginal distribution
# data
187.0 2507.3071 74.0778 12.1783 37.0
188.0 2551.4509 117.7900 19.3645 37.0
189.0 2602.8206 194.9535 32.0502 37.0
190.0 2701.8748 300.9678 49.4788 37.0
191.0 2813.3882 491.4593 80.7954 37.0
192.0 2990.6313 737.1098 121.1801 37.0
193.0 3258.0732 1111.2894 182.6949 37.0
194.0 3529.5684 1574.3077 258.8146 37.0
195.0 3835.0820 2043.3593 335.9262 37.0
196.0 4001.7227 2340.0701 384.7051 37.0
197.0 4051.6040 2460.2288 404.4591 37.0
198.0 3932.4873 2253.2725 370.4357 37.0
199.0 3677.1541 1835.4631 301.7483 37.0
200.0 3363.3704 1320.0219 217.0103 37.0
201.0 3083.9011 889.3854 146.2141 37.0
202.0 2892.8655 555.6920 91.3552 37.0
203.0 2740.6313 342.7261 56.3438 37.0
204.0 2637.1086 219.9106 36.1531 37.0
205.0 2574.2351 137.5822 22.6184 37.0
% cat Axes.20
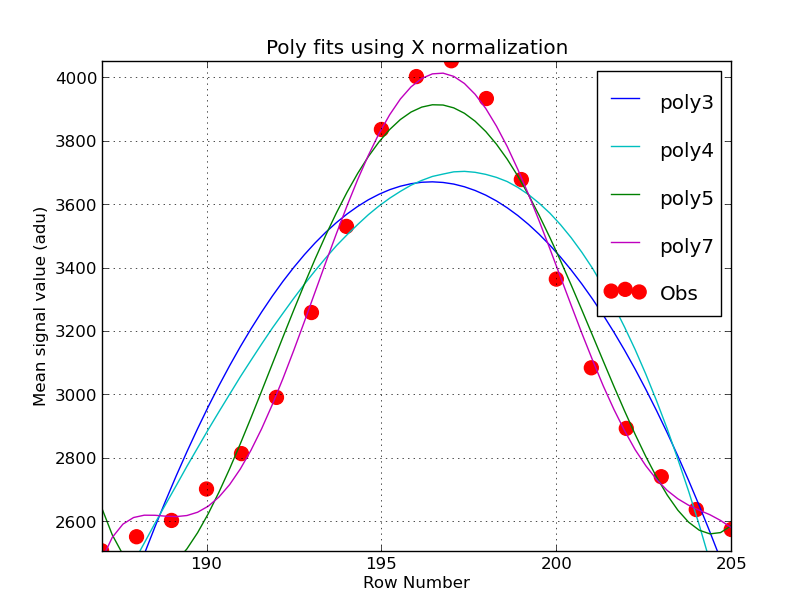
Poly fits using X normalization
187.00000 205.00000 Row Number
2507.30710 4051.60400 Mean signal value (adu)
% cat List.20
margdist_sub.table 1 2 0 0 point r o 100 Obs
poly3.fitcurve 1 2 0 0 line b - 10 poly3
poly4.fitcurve 1 2 0 0 line c - 10 poly4
poly5.fitcurve 1 2 0 0 line g - 10 poly5
poly7.fitcurve 1 2 0 0 line m - 10 poly7
% xyplotter List.20 Axes.20
I manually added the results of various xyfitter runs to the List.20 file to make
the plot below.
 |
|
An example of polynomial fitting to data from clip_margdist.sh. The
X data (Row values in pixel units) were averaged using the normit.sh routine in order
to avoid sever round-off error. The data are very peaky, so a k=7 term polynomial
gives the best estimate to the [center,peak] values.
|
Back to SCO CODES page