split_table_by_selector
Updated: Jun 16, 2019
Use the xyf.in file from a point_selector
run to divide the original table into two tables: one for the marked points, and
one for the unmarked points. As with the get_table_ros code, if a *.images file
is present, then corresponding image files are built for the Marked and NotMarked sets.
% split_table_by_selector --help

Usage: split_table_by_selector A1 N
arg1 = basename of the table file (e.g. A1 for A1.table)
arg2 = run in debug/verbose mode (Y/N)
Below is a plot from an example where I divide a table file into two tables (Marked
and NotMarked) and plotted them on top of the original parameter space.
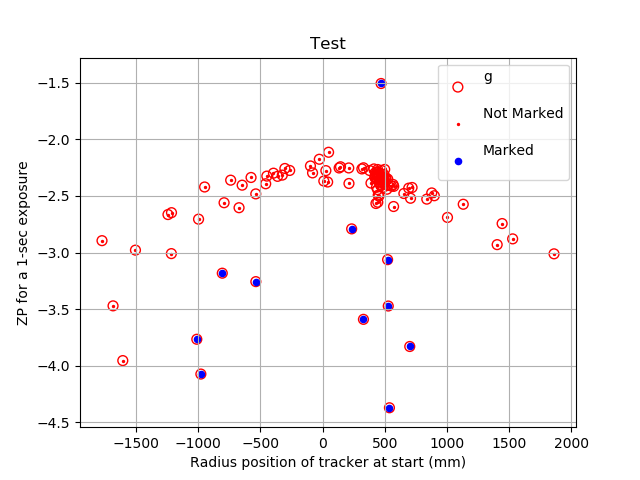 |
The original points from the g.table file are plotted as large open red circles.
The point_selector script was used to view this parameter space and a number of
points were marked with the "p" (for pick) option. The split_table_by_selector script
was then used to divide the g table into two new tables. I plot the NotMarked
table points with small red dots, and I plot the Marked table points with
thicker blue dots circles. Clearly the script has properly divided the two sets
of points. I could now use the "NotMarked" table as a cleaned data set.
Some of the more important commands used to do this are below:
% split_table_by_selector g Y

% cat List.20
g.table           5 9 0 0   pointopen  r o 50  g
NotMarked.table   5 9 0 0   point      r o 2   Not Marked
Marked.table      5 9 0 0   point      b o 20   Marked

% cat Axes.20
Test
  -1773.01510 1861.17750 Radius position of tracker at start (mm)
  -4.37120 -1.50670 ZP for a 1-sec exposure

% xyplotter List.20 Axes.20 N
|
Back to SCO CODES page