show_wcs_points
% show_wcs_points --help
show_wcs_points:
  Display the data points in a wcs data file like wcs_setup.out. This code
is assumed to be run after the image(s) aqre already diplayed with ds9. The
user will simply specifiy which image frame is to be used for overplotting the
regions file (one for X,Y coordinated and one for Ra,Dec coordinates).

Example:
show_wcs_points wcs_setup.out red 30

arg1 - name of data file with wcs fit points (usually wcs_setup.out)
arg2 - color of the text labels to be painted
arg3 - integer size of the text labels to be painted


To display points with large blue labels:
% show_wcs_points wcs_setup.out blue 20
 |
|
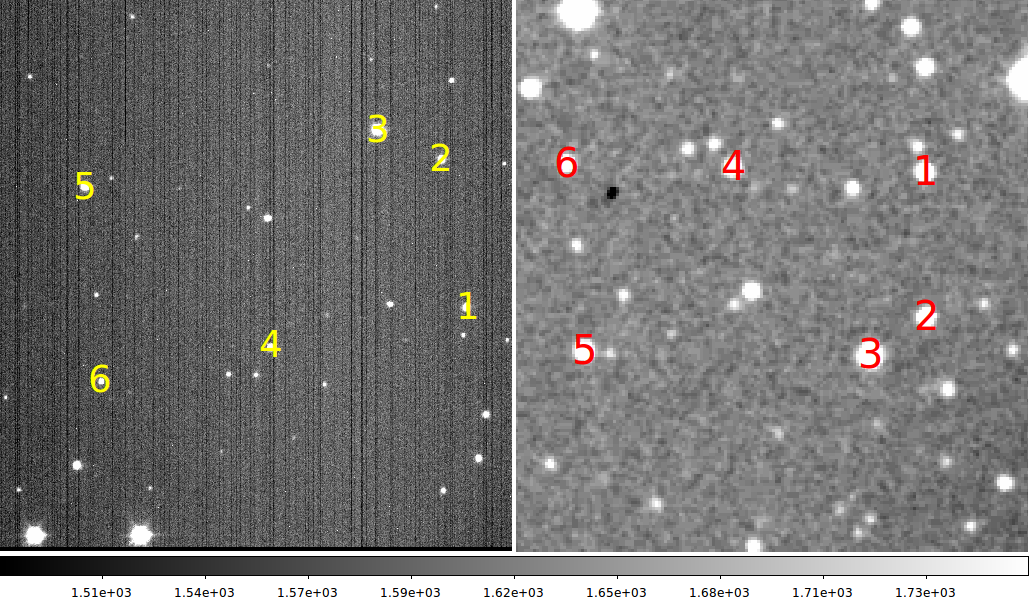
Here I have used the tool show_wcs_points to redisplay my test data points. The XY
coordinates are plotted in the left panel on the image I am calibrating. The Ra,Dec
coordinates are displayed in the right panel overplotted on a DSS image of the same
patch of sky.
|
Back to SCO CODES page