profiles_plotter
Updated: May29,2020
Plot radial brightness profiles for sources in gathered with
routine profiles.sh.
%  profiles_plotter.sh --help

usage: profiles_plotter.sh 10 [-v] [-i] [-h] [-ps < value >] [-ax < code >] [-ay < code >]
arg1 = integer number of target measured with profiles.sh
Additional options:
     -v  = print verbose comments and run in debug mode
     -i  = invoke interactive mode
     -h  = show a help file and then exit
     -ps = pixel scale to be applied (arcsec/pix or r50)
     -ax = x axis transofrm (r2,rQ)
     -ay = y sxis transofrm (log)
 |
|
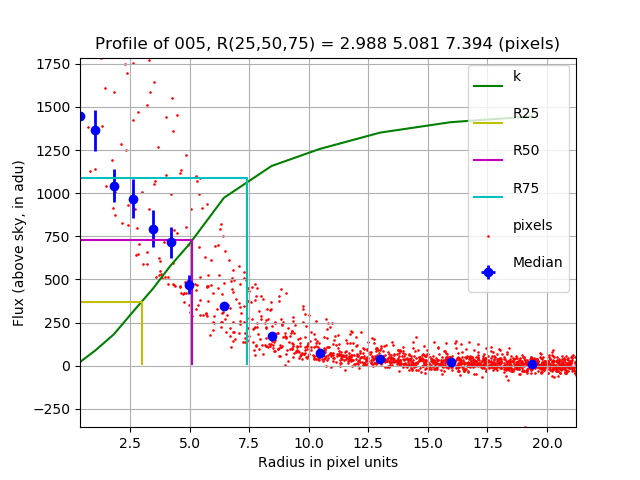
An example of a of a profile computed with profiles.sh and plotted with
this package (profiles-plotter.sh). This illustrates the standard format of
the profiles_plotter plot when no optional coomand line arguments are used.
Both axes ahave linear scaling, and the radial units are plotted in units
of pixels. The cummulative growth curve is plotted in green, and the
derived quartile radii (r25,r50,r75) are plotted illustrated respectively with
the yellow, magenta, and cyan line segments. The k-axis is scaled to match the
approximate range of the median annular profile (i.e. the min and max values of the
blue points).
|
The figure above was generated when I used no optional arguments on the command line.
We get linear scales on both axes, I plot individual pixel values, and I squeeze in the
flux growth curve. Below I show some examples of using the optional arguments. Because
axis scaling changes with some of these options, I decided to go with a simpler format:
the first plot shows the median flux profile with error bars and a second plot shows the
growth curve with the quartile parameters drawn in. Below are some examples:
 # plot profile 5 radii in units of arceoncd assuming a plate sclae of 1.35 "/pixel
 profiles_plotter.sh 5 -ps 1.35

 # plot log values on the Y-axis and arcsecond units on the X-axis
profiles_plotter.sh 5 -ps 1.35 -ay log

 # plot log values on the Y-axis and radii raised to 1/4
profiles_plotter.sh 5 -ps 1.35 -ax rQ -ay log
Obviously this stuff is designed primarily to look at disk- and bulge-dominated
galaxy profiles, but these axis functions are also handy to view and judge stellar
radial profiles.
I have some nice test directories (and README files) the following location as of May29,2020.
/home/sco/Profile_Play/
% ls /home/sco/Profile_Play/
acm_bad_focus/	acm_good_focus/  acm_many_stars/  pfc_gals/  pfc_many_stars/
These should probably sit in a less volatile place, but for now.....
Back to calling page