Assmbling acm bias correction files
Last updated: Jun 05, 2019
By far the most important correction for the acm images is a simple subtraction of
the substantial fixed bias pattern present in this camera.
 |
|
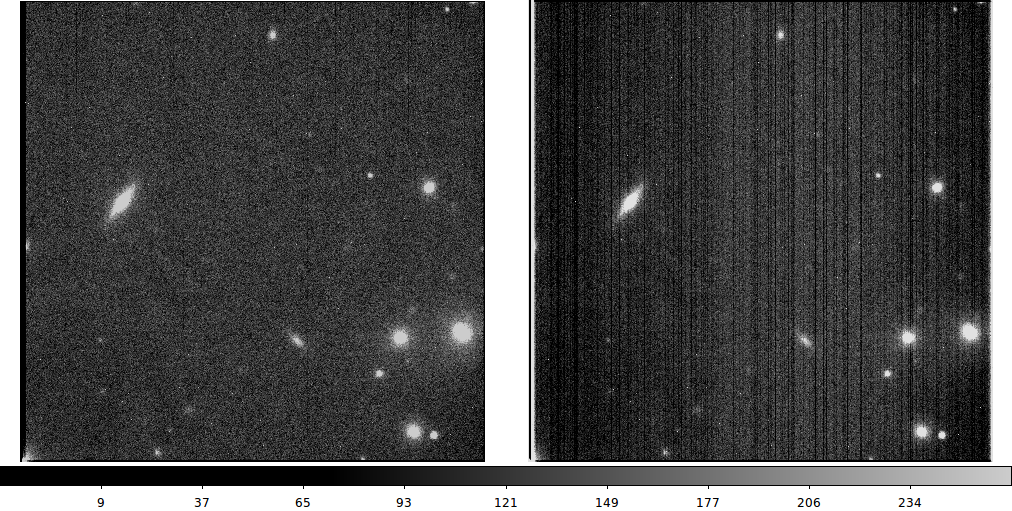
A typical example of the improvement we derive from a a simple bias
correction with the acm. A mean fixed bias pattern frame was computed
using nine bias images from the night of 20180115. The bias corrected
image in the left panel is from a 5 second acm image in the (Gunn) r
filter. The raw frame is shown in the right panel for comparison. It should be
noted that the mean sky signal in this corrected frame is 123.98 ± 0.03 adu.
For comparison, correcting a single bias frame (not used in the computing the
mean fixed bias pattern) yields a mean signal of 0.24 ± 0.02 adu.
|
The acm has a substantial fixed bias pattern (FBP) and the mean bias level
of the camera seems to float around the level of 1385 adu (± 6 adu).
# Building a master bias frame
% setenv date 20180206                    # optional
% acm_basic_list list.BIAS                # optional
% ds9_list_load list.BIAS                 # optional
% process_acm_bias list.BIAS 9 $date N
As you see, the only required step here is to run process_acm_bias, the script
that will stack (most or all) of the bias frame listed in the file list.BIAS. In
the first optional step I define a system variable named "date". I use this
as the identification string I feed to process_acm_bias (as arg3). The next
two optional lines allow me to view all of the images and summary information about
this. This sort of a last quality control check before assmbling the bias fame we'll
use to correct our acm images.
The images and files built isthis procedure are shown and explainsed below.
% ls
There are 3 basic image files made for a base image name = 20170906T020753.0_acm_sci  and date = 20170906
# Model zero-level (fbp) bias image (mean bias removed)   = 20170906T020753.0_acm_sci_FBP_20170906.fits
# Name of stacked bias image (mean bias not removed)      = 20170906T020753.0_acm_sci_BIAS_20170906.fits
# Stacked bias with FBP corrected (mean bias not removed) = 20170906T020753.0_acm_sci_FBPcorr_20170906.fits

The code also makes the fbp.parlab,table file             = mean bias subtracte fixed bias pattern model.
Hence, the mean bias level is best computed from the stacked image with the fixed bias pattern
removed (the _FBPcorr_ image).
Below I show two figures that demonstrate what we have done. The first (directly below)
shows aspects of the master bias and it's application.
 |
|
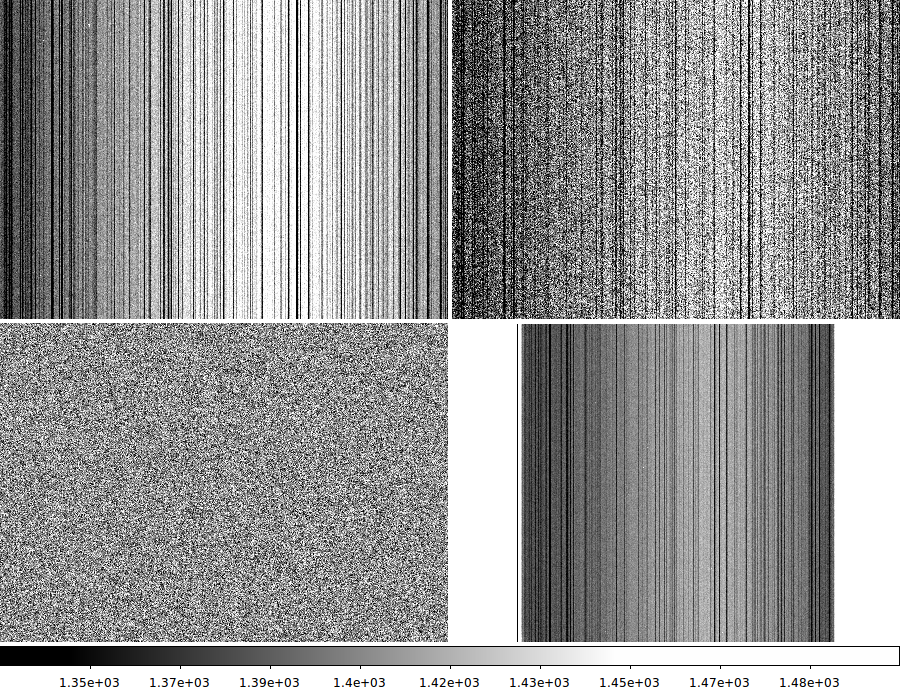
A section of the mean bias frame (a total of 21 acm bias frames) is shown in the
upper left. We see numerous vertical lines. In the upper-right is a single bias frame
of the same area (not included in the mean image stack). In the lower-left is the
same area of the single bias frame after subtracting the master mean bias. We see
a substantial improvement with regards to removing the fixed bias structure. Fianlly,
it the lower-right I show the full field image of the master bias frame to show the
large amount of bias structure in an acm image.
|
In our second figure I show how we can use the table file to build a plot that
shows the fixed bias pattern from our master stack using the
xyplotter_auto routine.
% cat 20180115T040325.2_acm_sci_BIAS_20180115_margdist_col.parlab
col   Column Number
mean  Mean signal value (adu)
sig   Standard devistion (adu)
me    Mean error about mean (adu)
Npix  Number of pixels

% xyplotter_auto 20180115T040325.2_acm_sci_BIAS_20180115_margdist_col col mean 1

# I use the matplotlib show() module I can adjust the plot as I see fit. I
  can also chhose to create a hard copy version of the plot, which I show below.
 |
|
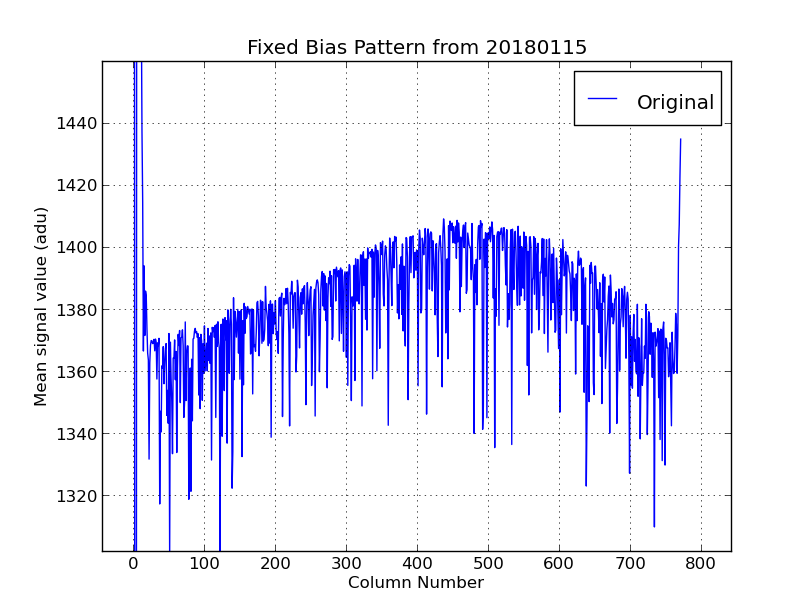
The fixed bias pattern computed with the process_acm_bias routine. Using the
matplotlib show() routine I have set the scale so that we can clearly see the
large scale properties of the acm fixed bias pattern. Despite the low resoltion
of this plot many of the bad columns in an acm bias are evident. The placement
and depth of these bad columns has remained fairly constant over the course of weeks.
Another major feature is the large-scale rise and drop in the bias signal across
the chip. The ammplitude of this feature is approximately 40 adu and hence is
extremely significant given that our average sky signals typically fall in the
range of a 50 to 300 adu. Furthermore, over a range of just 100 pixels (in the X
direction) the bias signal changes systematically by 10 adu or so (over much of
the image). Hence, without removing this source of systematic error, measurements
of profiles, sky surface brightness, or integrated magnitudes can be adversely affected.
|
Back to calling page