Example 3: Plotting from a single Table file
Here I am concerned cutting certian parts of table file and plotting them with different
symbols using xyplotter_auto.
You can do this in:   $scohtm/scocodes/munge/ex3_tables/work

I perform quick check (to make sure I have the params file):
% ls
GC.parlab  GC.table
% table_checker GC N
38 12
% ls
GC.params  GC.parlab  GC.table
*** I now have a params file, and I see that my table file has 38 data
    lines and 12 paramters (columns) in the table.

% cat GC.parlab
gc       guide probe used to offset
PickleP  gc pickle placement of guide star
dXo      Obsrved X offset in arcseconds
dXo      Obsrved Y offset in arcseconds
PAo      Obsrved Position Angle in degrees
Ro       Obsrved Total Offset in arcseconds
dXc      Commanded X offset in arcseconds
dXc      Commanded Y offset in arcseconds
PAc      Commanded Position Angle in degrees
PSgc1    Derived gc1 plate scale (arcsec/pix)
PSgc2    Derived gc2 plate scale (arcsec/pix)
ROT      Rotation (PAo-PAc, degrees)


*** First I want to isolate the gc1 data
% table_text_mask GC gc gc1 mask1

*** Next I make a table file of these
% get_table_rows GC mask1 gc1
% ls
gc1.params  gc1.parlab	gc1.table  GC.params  GC.parlab  GC.table  mask1  S/

*** I could plot just the gc1 data:
% xyplotter_auto gc1 PSgc1 PSgc2 1

**** What I really want is to divide gc1 into 3 section by PickleP

% table_text_mask gc1 PickleP ccw MASK
% get_table_rows gc1 MASK gc1_ccw

% table_text_mask gc1 PickleP cen MASK
% get_table_rows gc1 MASK gc1_cen

% table_text_mask gc1 PickleP cw MASK
% get_table_rows gc1 MASK gc1_cw

*** I edit my List.1 file to use these files:
% cat List.1
gc1_ccw.table   10 11 0 0   point    r o 70   gc1_ccw
gc1_cen.table   10 11 0 0   point    b o 70   gc1_cen
gc1_cw.table    10 11 0 0   point    g o 70   gc1_cw

I change the Axes.1 file:
% cat Axes.1
Plate scales when gc1 is guiding
  0.18069 0.21809 Derived gc1 plate scale (arcsec/pix)
  0.17779 0.21302 Derived gc2 plate scale (arcsec/pix)

I make the plot:
% xyplotter List.1 Axes.1

Next I make another plot with these same files:
% xyplotter_auto gc1_ccw  Ro  ROT  2
You can read a more detailed discussion of xyplotter_auto and
see different exmaples of making plots. Below is the final plot I made.
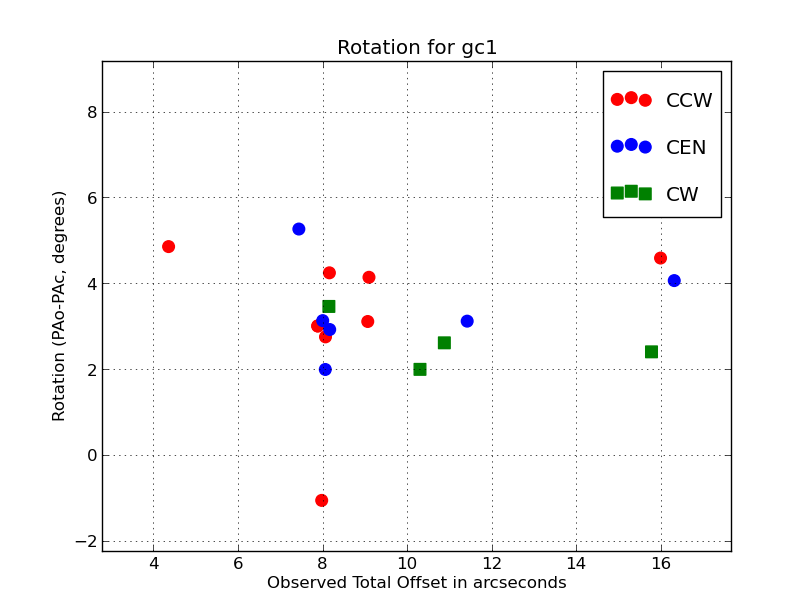 |
The field rotation between commanded and observed gc1 orientations.
% cat ../work/Axes.1
% cat Axes.2
Rotation for gc1
  4.35900 15.99100 Observed Total Offset in arcseconds
  -1.05900 4.85400 Rotation (PAo-PAc, degrees)
% cat List.2
gc1_ccw.table   6 12 0 0   point  r o 70    CCW
gc1_cen.table   6 12 0 0   point  b o 70    CEN
gc1_cw.table    6 12 0 0   point  g s 70    CW

% xyplotter List.2 Axes.2
This plot was made in just a couple minutes of cutting up the original GC file.
|
Back to calling page