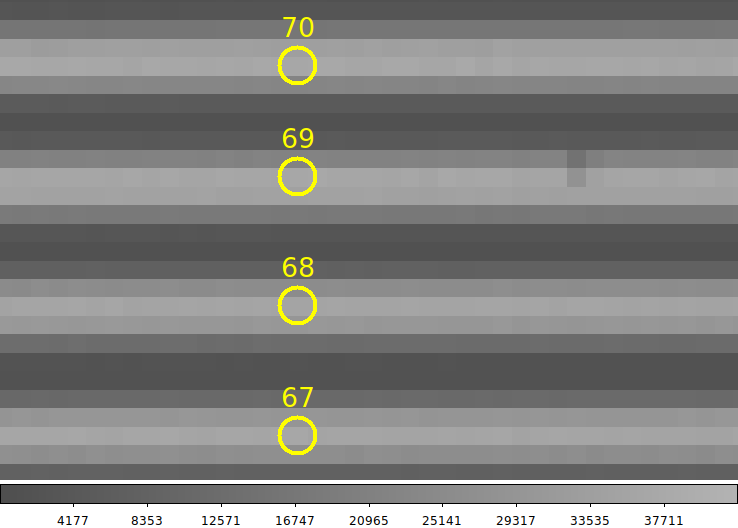
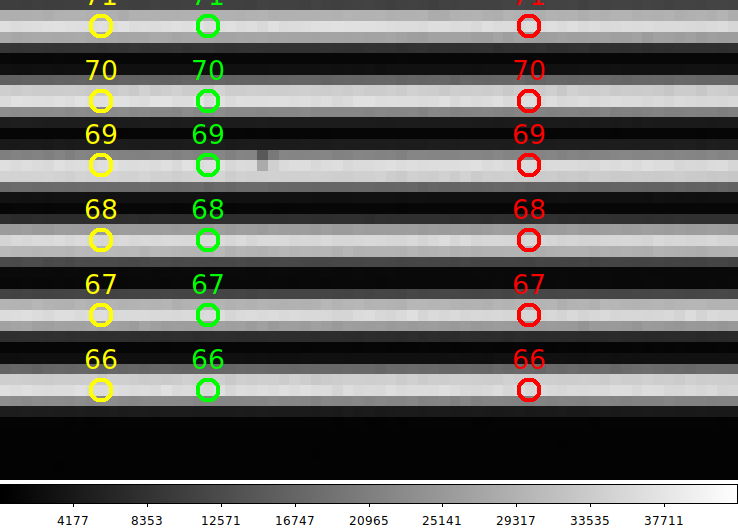
Use peak detection to locate fiber spectra in a LRS2 image.
%
% lmap_peaker -h

usage: lmap_peaker FrameNum [-v] [-h] [-F font] [-c color]
arg1 = ds9 frame number (usually 1 or 3)
Additional options:
  -h  = just show usage message
  -v  = run in verbose/debug mode
  -p  = display a plot of the fiber positions
  -c  = specify name of a configuration file
  -cl = list and explain recognized config file parameter
You can specify parameters (beyond default values) witha confguration
file. Here is an example:
% cat s.1
color      yellow
font       27
YsigMIN    3500
YsigMAX    45600

% lmap_peaker 1 -c s.1             # assumes the Frame.1 file is present

% cat Frame.1
 Upper  180

% cat Name.Upper
/media/sco/DataDisk1/sco/AD/HET_work/HET_acm+lrs2/HET_IZw136/20200529/lrs2/lrs20000019/exp01/lrs2/20200529T230158.3_066LU_flt.fits

# To make a plot during the run
% lmap_peaker 1 -c s.1 -p

# To use only default parameter values
% lmap_peaker 1

Here is an example of the file created:
% ls
20200529T230158.3_066LU_flt_1000_peaks.params  20200529T230158.3_066LU_flt.fits  fiber_peaks.png  Name.Upper
20200529T230158.3_066LU_flt_1000_peaks.parlab  20200529T230158.3_066LU_flt.Info  Frame.1	  README
20200529T230158.3_066LU_flt_1000_peaks.reg     BaseDir				 Frame.3	  S/
20200529T230158.3_066LU_flt_1000_peaks.table   Date				 Name.Lower	  s.1
Below I show an example of the peak locations found with this routine.