Wavelength calibration for LRS2 images.
Updated: Sep14,2020
As usual, I should have read some of my older docs before coding up some new routines. You
can read about my older (2016) wavelength
calibrations for LRS2. Here are some codes from that and the newer routine I used
at the end of this work:
Older routines (2016)

Usage: specfit 1 LL_lrs2b.solution ALL
arg1 - ds9 frame number to work in
arg2 - wavelength solution file
arg3 - line group (ALL,Cd,Hg)

% pix2angs.sh
Usage: pix2angs.sh 250.2  LL_lrs2b.solution
arg1 - pixel value
arg2 - name of linear solution file

% angs2pix.sh
Usage: angs2pix.sh 6564.2  LL_lrs2b.solution
arg1 - wavelength in Angstroms
arg2 - name of linear solution file

% spec_lines_show
% spec_lines_show
Usage: spec_lines_show 1 ./20160311T012519.2_056LU_sci.fits LL_lrs2b.solution 20 cyan ALL
arg1 - ds9 frame number to work in
arg2 - image name
arg3 - wavelength solution file
arg4 - font size for line labels (20)
arg5 - color for line labels (cyan)
arg6 - spectral line group (ALL,Cd,Hg)
# This is really what I am after!!!!

New routine
% lrs2_wavesol
usage: lrs2_wavesol fr_066RL_lines [-v] [-h]
arg1 = table basename
Additional options:
  -h = just show usage message
  -v = run in verbose/debug mode
The lrs2_wavesol routine was sort of kluged together, but it uses my newer table file
and fitting routines. However, I much prefer the format of the solutions files from the
older specfit code (because I included the error estimates for each parameyter: slope
and Y-intercept. The angs2pix.sh and pix2angs.sh routines are useful, but they only do
one line at a time. These were written before I knew about the terrible overhead of
scripts, so I should really make versions that work on lists of X or wavelengths.
One thing to note is that the spectal images I show in frames 1 and 3 (with lrs2see4)
are NOT the bias subtracted versions and (at least for the Orange channel) have:
   frame 1 - 056RL
   frame 3 - 056RU
Also, the Y direction in the top image (RL) is flipped: if I plot a low Y position
it appears in the top of the image. The bottom image (RU) plots normally. I need to
get straight where/how I do this flipping. I need to be sure I am addressing the
fiber spectral Y positions properly.
Answer:
The flip/rotate stuff for displaying the spectral images is done in "lrs2see4"
Here is how I handle each channel:

UV:
 Top (frame1)  UPPER   xpaset -p ds9 rotate to 180
 Bot (frame3)  LOWER   xpaset -p ds9 rotate to 0

ORANGE:
 Top (frame1)  LOWER   xpaset -p ds9 rotate to 180
 Bot (frame3)  UPPER   xpaset -p ds9 rotate to 0

RED:
 Top (frame1)  UPPER   xpaset -p ds9 rotate to 180
 Bot (frame3)  LOWER   xpaset -p ds9 rotate to 0

FARRED:
 Top (frame1)  LOWER   xpaset -p ds9 rotate to 180
 Bot (frame3)  UPPER   xpaset -p ds9 rotate to 0

BUT, the Peak finding and the fiber integrations are done on the
bias-subtracted but unrotated images.

In the code lrs2_gather_signals.sh I feed it the channel name, and here
I apply the sign flips to keep my Y positions straight.
 |
|
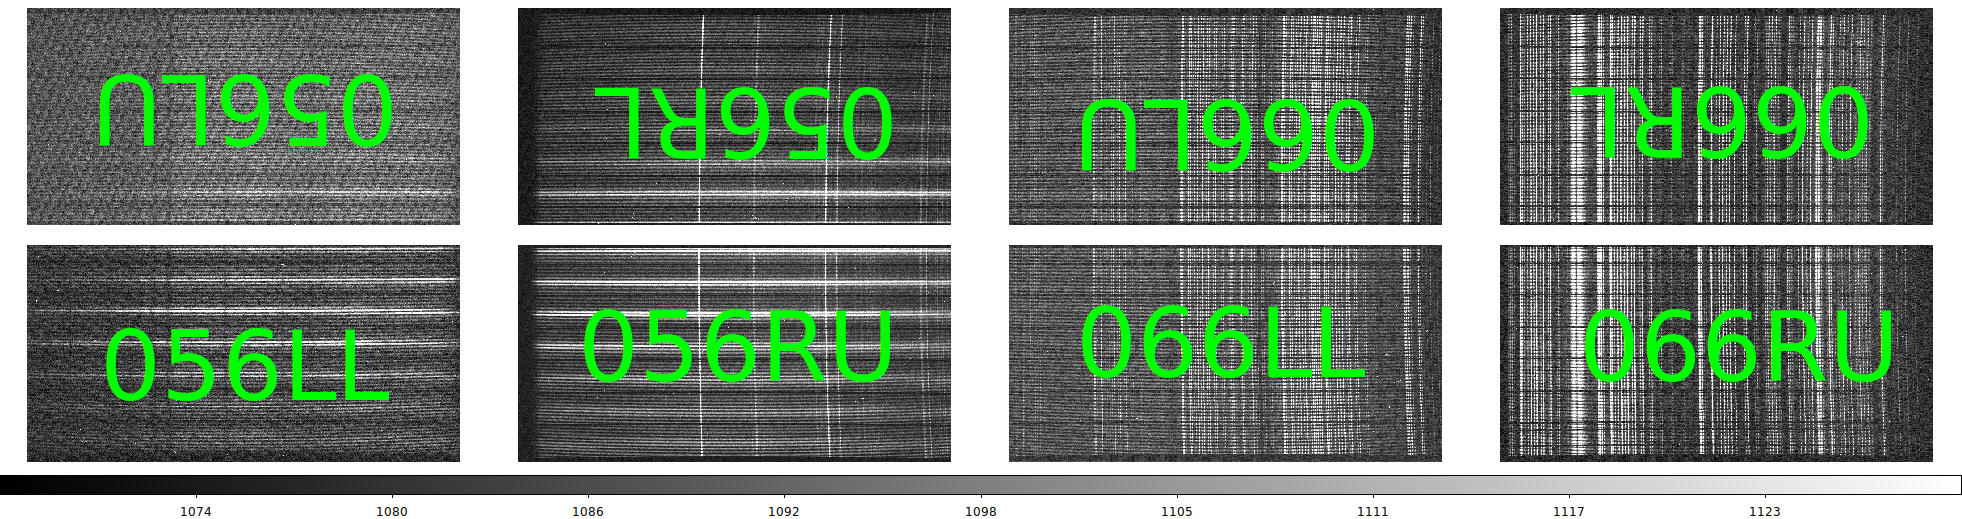
The LRS2 spectral images for all 4 channels (8 amps) of the
IZw136 images of 20200530. In all images we have Blue to the LEFT
and Red to the RIGHT. This was made with the lds alias, and the image
text identifications were added manually. Note that in the rotated frames
the text id is upside down.
|
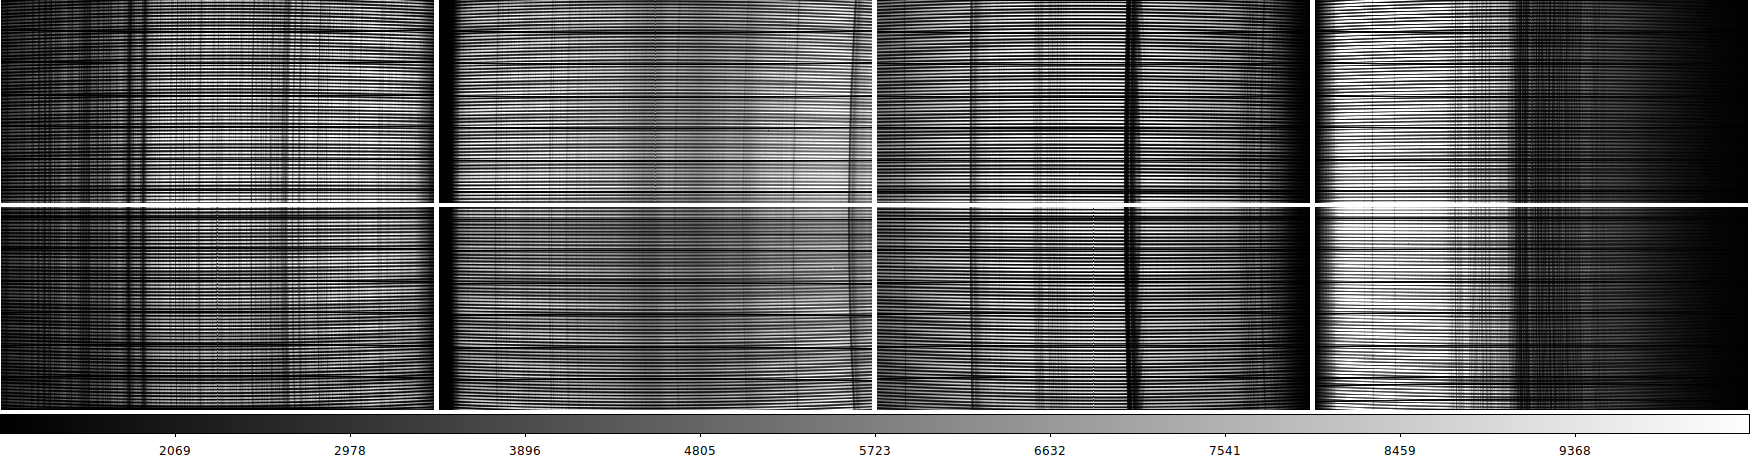 |
This is an lds view of a twilight flat from 20200530. We can use this to
verify the spectral orientations in the secondary view for the new code
I am developing named lmap_tracer. In this code I'll identify and label
the fiber peaks with ds9 text markers. I can also get definitive fiber
orientations for each amp in each LRS2 channel. I will insure that
- The short fiber sections meet in the middle of the spectral channel sets.
- We always have Blue to the left and Red right.
To run each channel through lmap_tracer I do this:
% cd /home/sco/Aug2020_lmap/run_20200530
% ls
BaseDir  Date  RUN*  S/
%  lmap_tracer 3 1 or      # To view UV channel of this twilight
% ls
BaseDir  Date  Name.Lower  Name.Upper  Peaks_1000_lrs2_Lower_or  Peaks_1000_lrs2_Upper_or  RUN*  S/
% cat Name.Lower
/media/sco/DataDisk1/sco/AD/HET_work/HET_acm+lrs2/HET_IZw136/20200530/lrs2/lrs20000003/exp01/lrs2/20200530T020839.0_056RL_twi.fits
% cat Name.Upper
/media/sco/DataDisk1/sco/AD/HET_work/HET_acm+lrs2/HET_IZw136/20200530/lrs2/lrs20000003/exp01/lrs2/20200530T020839.0_056RU_twi.fits
|
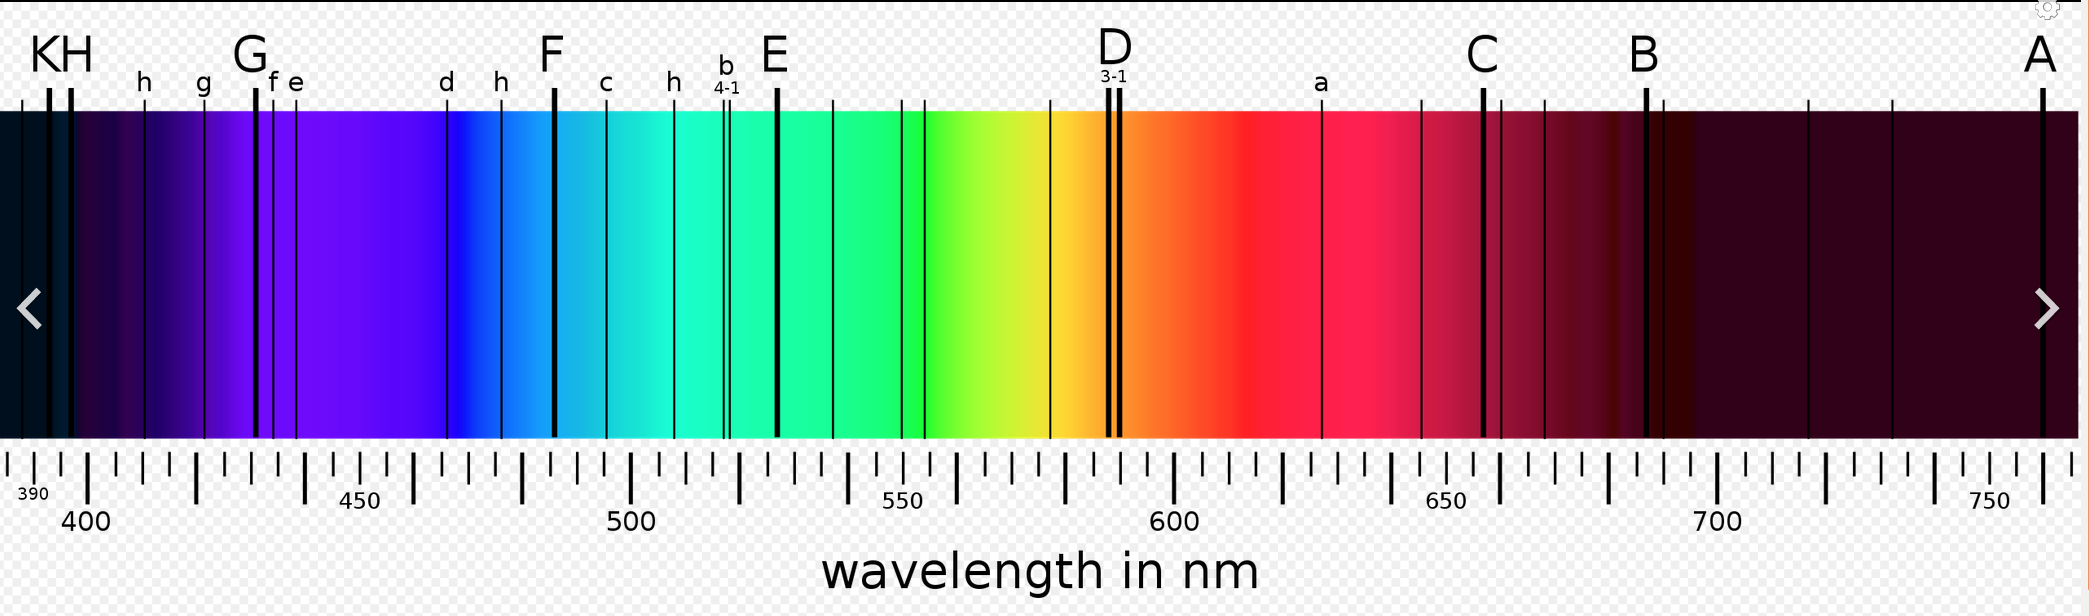 |
The solar spectrum with some of the Fraunhofer lines marked.
I will use this
|
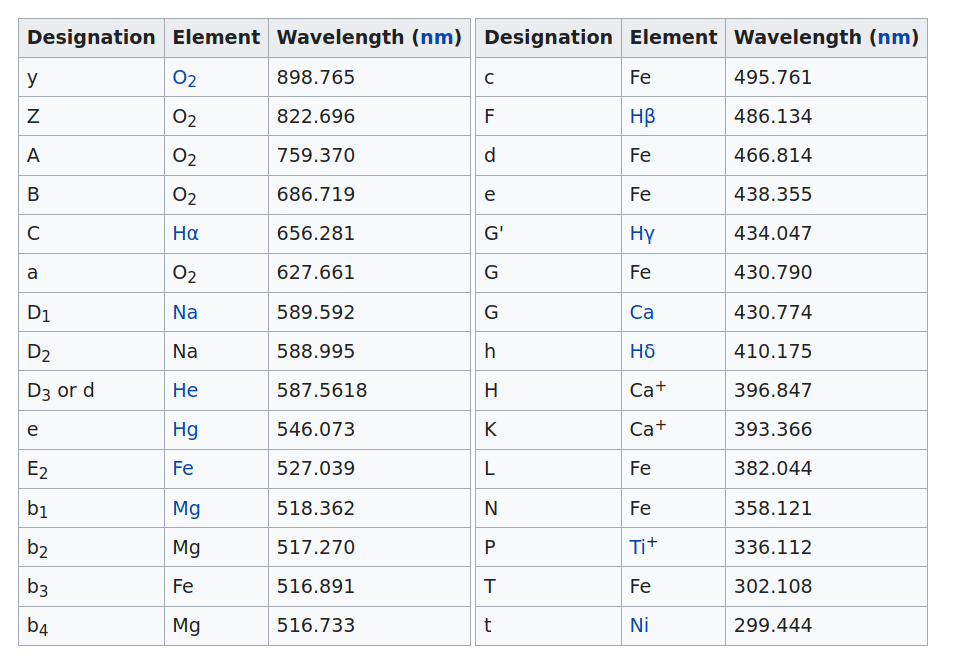 |
A table of Fraunhofer lines, some of which can be seen the twilight spectrum above.
  LRS2 arm     Wavelenth Range
  --------     ---------------
    UV           3700   4700
    Orange       4600   7000
    Red          6500   8420
    Far-Red      8180  10500

  Name          Wavelenght(angs)     X_pixels    channel

  CaII_K          3934.000          1456           uv (056LU)
  CaII_H          3968.000          1385           uv (056LU)
  G_band_L        4305.000           710           uv (056LU)

  F (H beta)      4861              1790           or (056RL)
  E (Fe)          5270              1521           or (056RL)
  D (Na)          5893.000           932           or (056RL)
  a (O2)          6277               606           or (056RL)
  C (H alpha)     6563               364           or (056RL)
  B (O2)          6867                97           or (056RL)

  C (H alpha)     6563              1932           rd (066LU)
  B (O2)          6867              1619           rd (066LU)
  A (O2)          7593.700           878           rd (066LU)
  Z (O2)          8227               232           rd (066LU)

=================================================================================

Far-Red is a little tough with just twilight alone

  Name          Wavelenght(angs)     X_pixels    channel
  y (O2)          8987.65           1396           fr (066RL)     (Maybe)

For Hg arc:     % lmap_tracer 23 1 fr       # date = 20200529
For FeAr arc:   % lmap_tracer 22 1 fr       # date = 20200529

  Hg(bright)      10139.76           384           fr (066RL)

  FeARfaint       10470.0             82           fr (066RL)
  FeAr             9784.5            699           fr (066RL)
  FeAr             9657.7            811           fr (066RL)
  FeAr             9224.5           1193           fr (066RL)
  FeAr             9123.0           1281           fr (066RL)
  FeAr             8521.4           1808           fr (066RL)
  FeAr             8264.5           2036           fr (066RL)
|
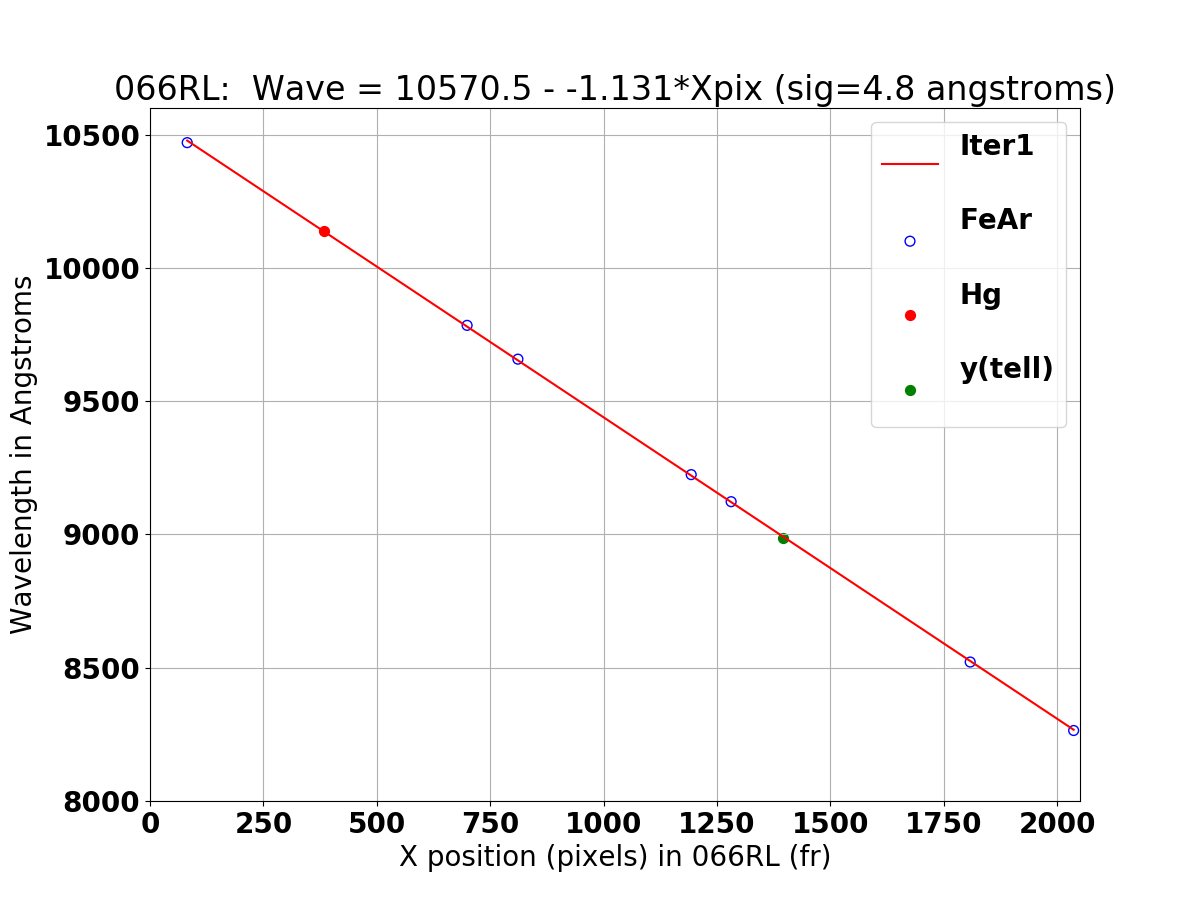
After a lot of horsing around with line listsa I was able to identify lines
from several fr (066RL) images. I jsut use visual (very rough!) X positions
for the lines by eyeballing lam_trace graphics. The fit is shown below and it
ispretty good for such a crude approach!
 |
|
A fit to lines from the twilight, FeARm and Hg cal images for the fr
channel (066RL) LRS2 images from 20200529/30. The line X positions
were made in a very crude fashion, but the line identifications were
obviously correct.
|
/home/sco/Aug2020_lmap/run_20200530/Line_reg_files

=================================================================================================================
To convert XRL to the XRU system:      XRU = 2066 - XRL   (pixels)

Far-Red lines ,  Using the raw images for FeAr arc  (To view:  lmap_tracer 22 1 fr    # date = 20200529)
% cat fr_066RL_lines_raw.reg
image
# text(81.997664,518.20558) textangle=269.55264 font="helvetica 14 normal roman" text={FeAR 10470ang 82pix}
# text(699,518.0) textangle=269.55264 font="helvetica 14 normal roman" text={FeAR 9784.5ang 699pix}
# text(811,518.0) textangle=269.55264 font="helvetica 14 normal roman" text={FeAR 9657.7ang 811pix}
# text(1193,518.0) textangle=269.55264 font="helvetica 14 normal roman" text={FeAR 9224.5ang 1193pix}
# text(1281,518.0) textangle=269.55264 font="helvetica 14 normal roman" text={FeAR 9123.0ang 1281pix}
# text(1808,518.0) textangle=269.55264 font="helvetica 14 normal roman" text={FeAR 8521.4ang 1808pix}
# text(2036,518.0) textangle=269.55264 font="helvetica 14 normal roman" text={FeAR 8264.5ang 2036pix}

% cat fr_066RU_lines_raw.reg
image
# text(1984.1911,536.82216) textangle=269.55264 font="helvetica 14 normal roman" text={FeAR 10470ang 1984pix}
# text(1369.9128,517.0872) textangle=269.55264 font="helvetica 14 normal roman" text={FeAR 9784.5ang 1369pix}
# text(1258.7384,517.0872) textangle=269.55264 font="helvetica 14 normal roman" text={FeAR 9657.7ang 1258pix}
# text(876.96179,495.99007) textangle=269.55264 font="helvetica 14 normal roman" text={FeAR 9224.5ang 876pix}
# text(788.96179,507.87543) textangle=269.55264 font="helvetica 14 normal roman" text={FeAR 9123.0ang 788pix}
# text(258,518) textangle=269.55264 font="helvetica 14 normal roman" text={FeAR 8521.4ang 258pix}
# text(30,518) textangle=269.55264 font="helvetica 14 normal roman" text={FeAR 8264.5ang 30pix}
=================================================================================================================
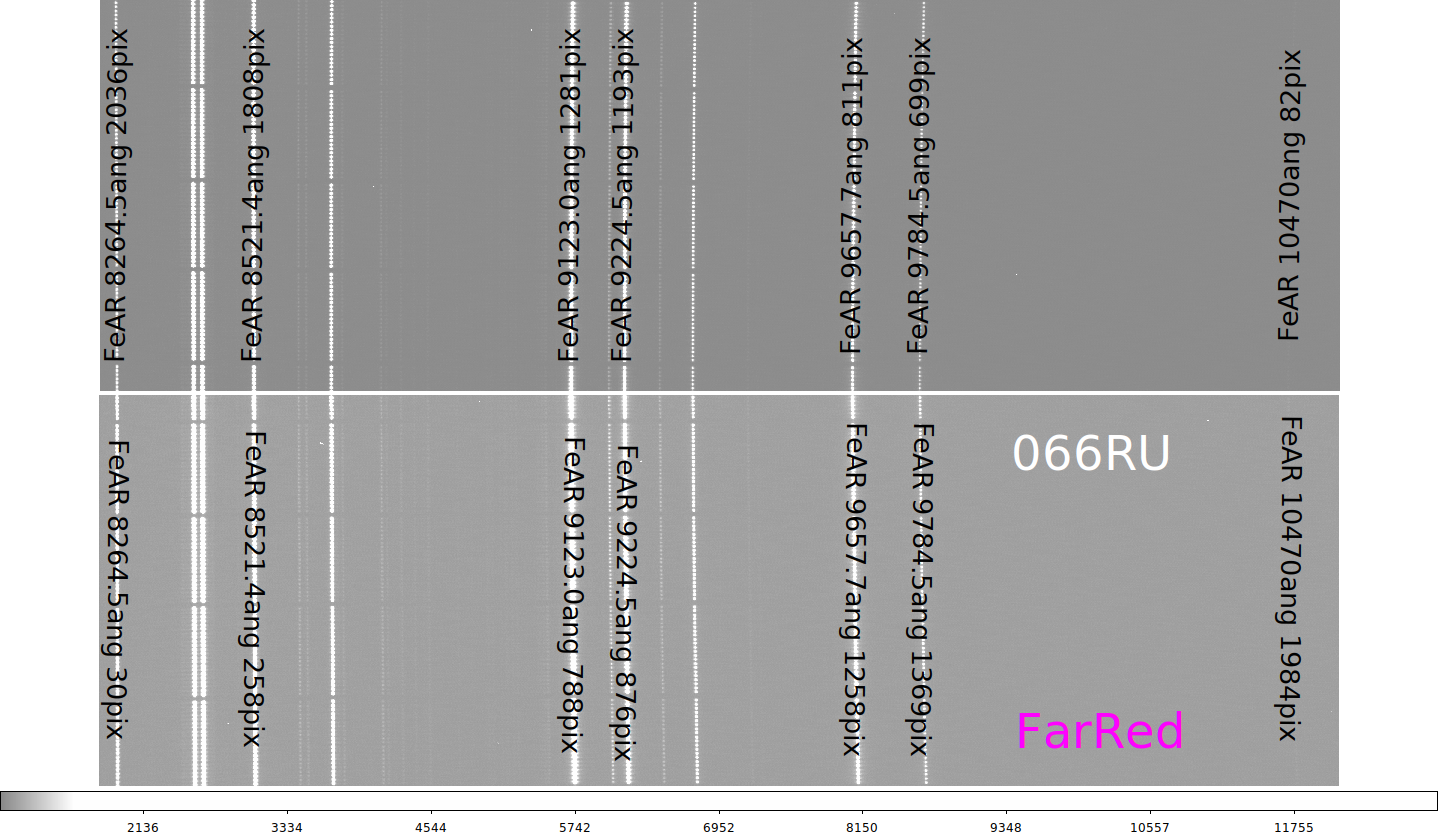 |
A dar-red (fr) channel FeAr arc taken 20200529. The top is 066RL and the bottom
is 066RU. The line identifications are made with:
=================================================================================================================
To convert XRL to the XRU system:      XRU = 2066 - XRL   (pixels)

Far-Red lines ,  Using the raw images for FeAr arc  (To view:  lmap_tracer 22 1 fr    # date = 20200529)
% cat fr_066RL_lines_raw.reg
image
# text(81.997664,518.20558) textangle=269.55264 font="helvetica 14 normal roman" text={FeAR 10470ang 82pix}
# text(699,518.0) textangle=269.55264 font="helvetica 14 normal roman" text={FeAR 9784.5ang 699pix}
# text(811,518.0) textangle=269.55264 font="helvetica 14 normal roman" text={FeAR 9657.7ang 811pix}
# text(1193,518.0) textangle=269.55264 font="helvetica 14 normal roman" text={FeAR 9224.5ang 1193pix}
# text(1281,518.0) textangle=269.55264 font="helvetica 14 normal roman" text={FeAR 9123.0ang 1281pix}
# text(1808,518.0) textangle=269.55264 font="helvetica 14 normal roman" text={FeAR 8521.4ang 1808pix}
# text(2036,518.0) textangle=269.55264 font="helvetica 14 normal roman" text={FeAR 8264.5ang 2036pix}

% cat fr_066RU_lines_raw.reg
image
# text(1984.1911,536.82216) textangle=269.55264 font="helvetica 14 normal roman" text={FeAR 10470ang 1984pix}
# text(1369.9128,517.0872) textangle=269.55264 font="helvetica 14 normal roman" text={FeAR 9784.5ang 1369pix}
# text(1258.7384,517.0872) textangle=269.55264 font="helvetica 14 normal roman" text={FeAR 9657.7ang 1258pix}
# text(876.96179,495.99007) textangle=269.55264 font="helvetica 14 normal roman" text={FeAR 9224.5ang 876pix}
# text(788.96179,507.87543) textangle=269.55264 font="helvetica 14 normal roman" text={FeAR 9123.0ang 788pix}
# text(258,518) textangle=269.55264 font="helvetica 14 normal roman" text={FeAR 8521.4ang 258pix}
# text(30,518) textangle=269.55264 font="helvetica 14 normal roman" text={FeAR 8264.5ang 30pix}
|
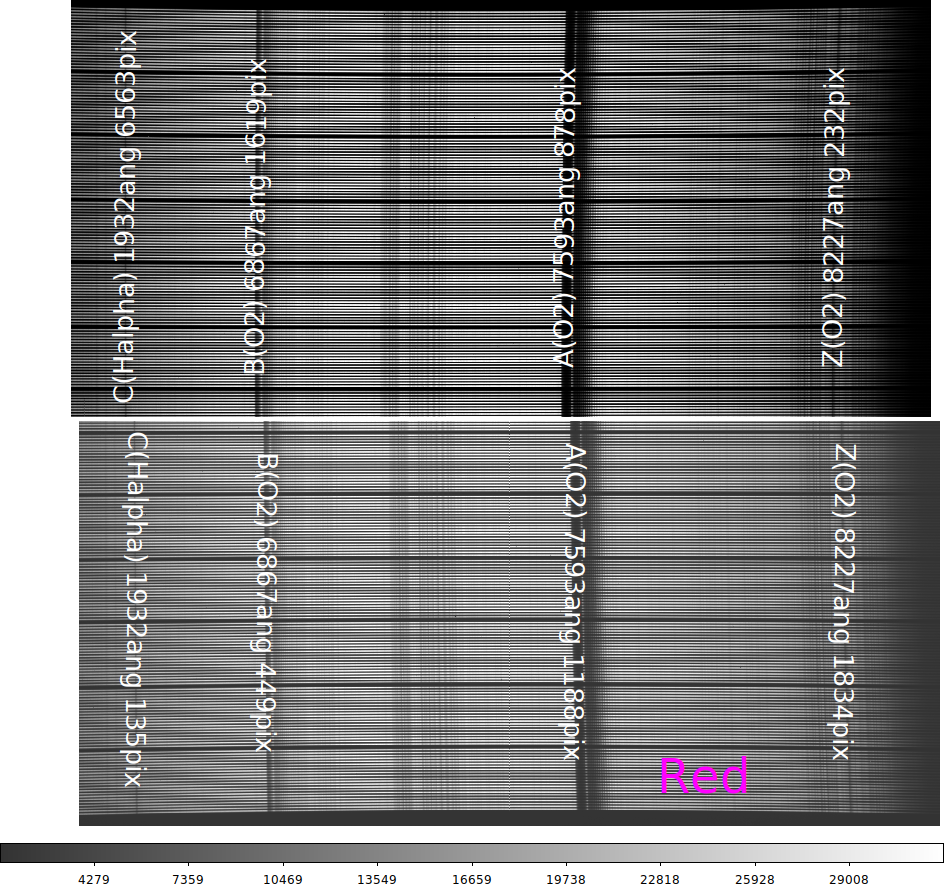 |
A red (rd) channel twilight taken 20200530. The top is 066LU and the bottom
is 066LL. The line identifications are made with:
% lmap_tracer 3 1 rd           # date = 20200530

% cat rd_066LU_lines.reg
image
# text(1932,536) textangle=269.55264 color=white font="helvetica 20 normal roman" text={C(Halpha) 6563ang 6563pix}
# text(1619,536) textangle=269.55264 color=white font="helvetica 20 normal roman" text={B(O2) 6867ang 1619pix}
# text(878,536) textangle=269.55264 color=white font="helvetica 20 normal roman" text={A(O2) 7593ang 878pix}
# text(232,536) textangle=269.55264 color=white font="helvetica 20 normal roman" text={Z(O2) 8227ang 232pix}

% cat rd_066LL_lines.reg
image
# text(137.39804,519.21372) textangle=269.55264 color=white font="helvetica 20 normal roman" text={C(Halpha) 6563ang 135pix}
# text(449,536) textangle=269.55264 color=white font="helvetica 20 normal roman" text={B(O2) 6867ang 449pix}
# text(1188,536) textangle=269.55264 color=white font="helvetica 20 normal roman" text={A(O2) 7593ang 1188pix}
# text(1834,536) textangle=269.55264 color=white font="helvetica 20 normal roman" text={Z(O2) 8227ang 1834pix}
|
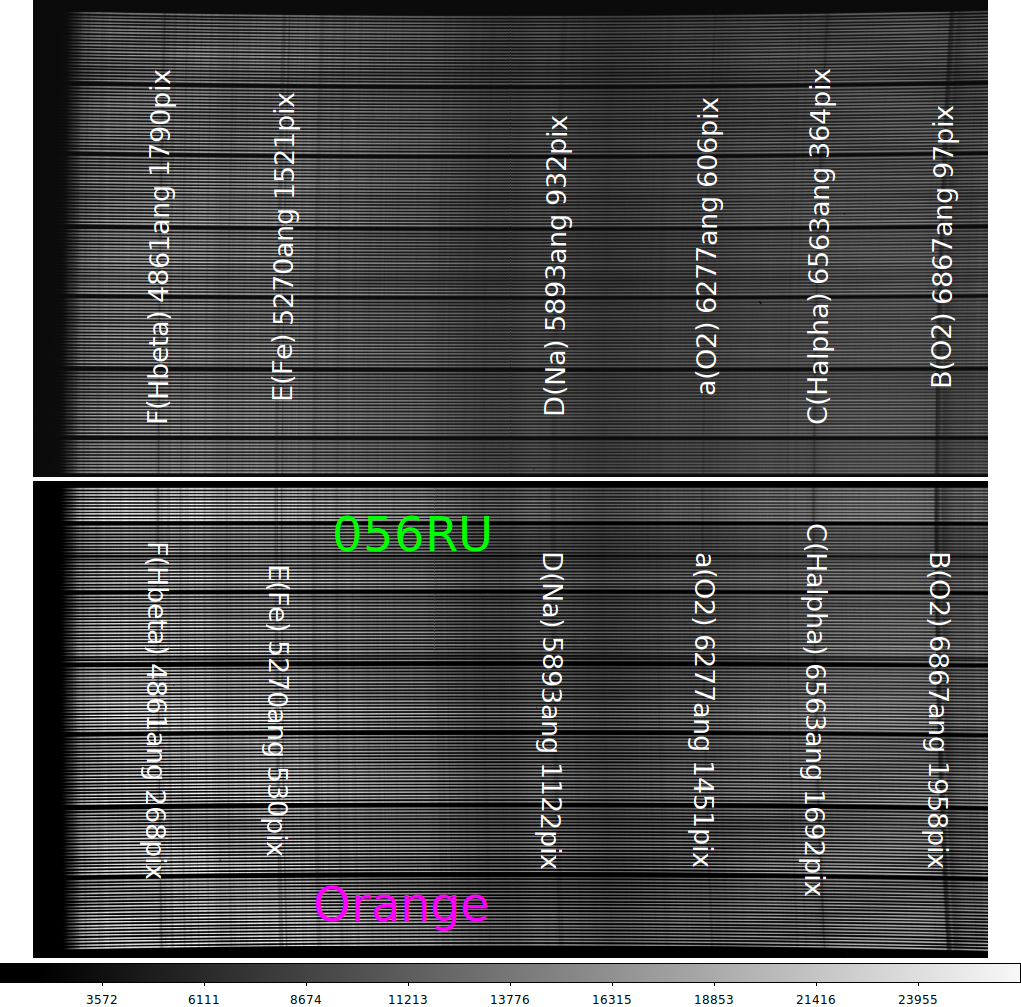 |
An orange (or) channel twilight taken 20200530. The top is 056RL and the bottom
is 056RU. The line identifications are made with:
% lmap_tracer 3 1 or           # date = 20200530

% cat or_056RL_lines.reg
image
# text(1521,536) textangle=269.55264 color=white font="helvetica 20 normal roman" text={E(Fe) 5270ang 1521pix}
# text(1790,536) textangle=269.55264 color=white font="helvetica 20 normal roman" text={F(Hbeta) 4861ang 1790pix}
# text(932.49396,577.63263) textangle=269.55264 color=white font="helvetica 20 normal roman" text={D(Na) 5893ang 932pix}
# text(606,536) textangle=269.55264 color=white font="helvetica 20 normal roman" text={a(O2) 6277ang 606pix}
# text(364,536) textangle=269.55264 color=white font="helvetica 20 normal roman" text={C(Halpha) 6563ang 364pix}
# text(97,536) textangle=269.55264 color=white font="helvetica 20 normal roman" text={B(O2) 6867ang 97pix}

% cat or_056RU_lines.reg
image
# text(268,536) textangle=269.55264 color=white font="helvetica 20 normal roman" text={F(Hbeta) 4861ang 268pix}
# text(530,536) textangle=269.55264 color=white font="helvetica 20 normal roman" text={E(Fe) 5270ang 530pix}
# text(1122,536) textangle=269.55264 color=white font="helvetica 20 normal roman" text={D(Na) 5893ang 1122pix}
# text(1451,536) textangle=269.55264 color=white font="helvetica 20 normal roman" text={a(O2) 6277ang 1451pix}
# text(1692,536) textangle=269.55264 color=white font="helvetica 20 normal roman" text={C(Halpha) 6563ang 1692pix}
# text(1958,536) textangle=269.55264 color=white font="helvetica 20 normal roman" text={B(O2) 6867ang 1958pix}
|
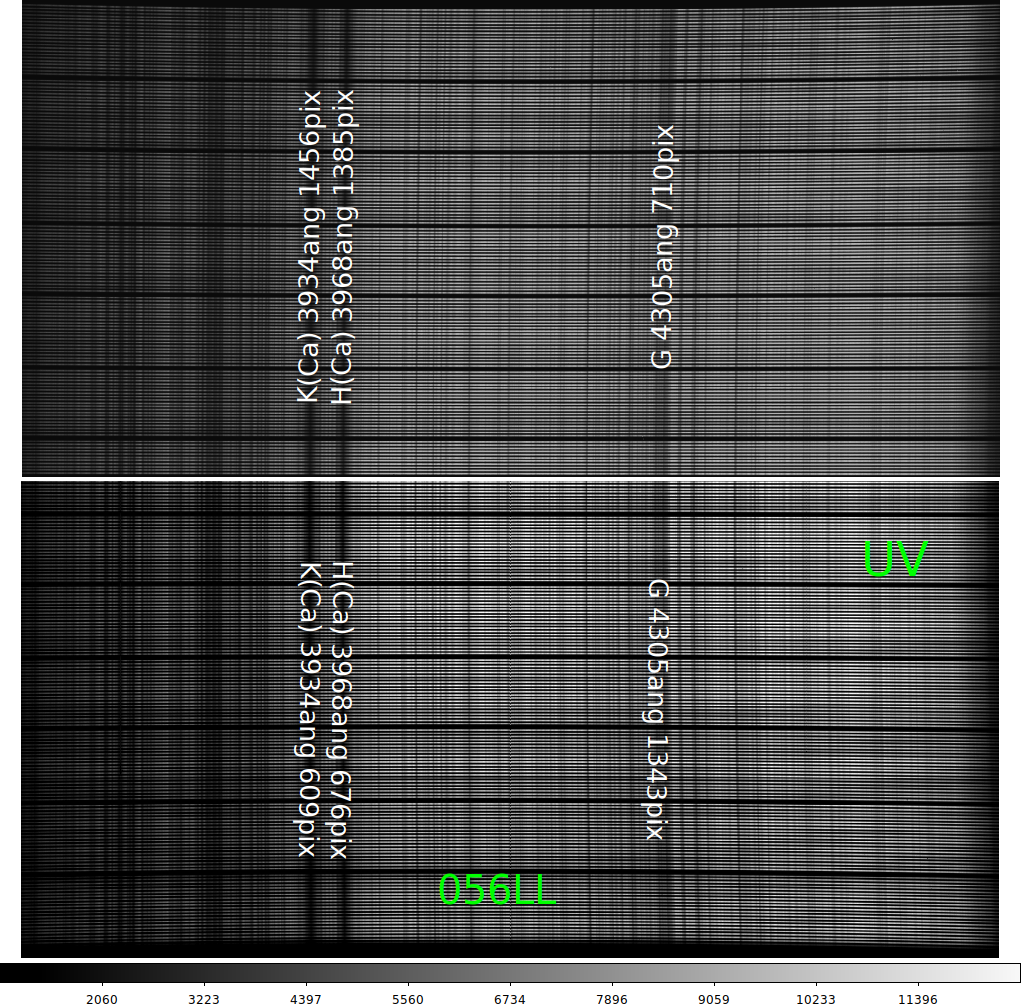 |
A uv channel twilight taken 20200530. The top is 056LU and the bottom
is 056LL. The line identifications are made with:
% lmap_tracer 3 1 uv           # date = 20200530

% cat uv_056LU_lines.reg
image
# text(1456,536) textangle=269.55264 color=white font="helvetica 20 normal roman" text={K(Ca) 3934ang 1456pix}
# text(1385,536) textangle=269.55264 color=white font="helvetica 20 normal roman" text={H(Ca) 3968ang 1385pix}
# text(710,536) textangle=269.55264 color=white font="helvetica 20 normal roman" text={G 4305ang 710pix}

% cat uv_056LL_lines.reg
image
# text(609,536) textangle=269.55264 color=white font="helvetica 20 normal roman" text={K(Ca) 3934ang 609pix}
# text(676,536) textangle=269.55264 color=white font="helvetica 20 normal roman" text={H(Ca) 3968ang 676pix}
# text(1343,536) textangle=269.55264 color=white font="helvetica 20 normal roman" text={G 4305ang 1343pix}
|
LRS2 wavelength solutions (raw images)
Form:  wave = zp + a*X

To run these:  lrs2_wavesol
usage: lrs2_wavesol fr_066RL_lines [-v] [-h]
arg1 = table basename
Additional options:
  -h = just show usage message
  -v = run in verbose/debug mode

   fr_066RL  zp=10570.6  a= -1.1313  sig=  4.85709  N=     7
   fr_066RU  zp= 8232.0  a=  1.1308  sig=  3.44360  N=     7

   rd_066LL  zp= 6428.9  a=  0.9801  sig=  1.57793  N=     4
   rd_066LU  zp= 8453.5  a= -0.9792  sig=  1.17495  N=     4

   or_056RL  zp= 6992.0  a= -1.1873  sig=  7.36714  N=     5
   or_056RU  zp= 4548.8  a=  1.1889  sig=  8.00261  N=     5

   uv_056LL  zp= 3626.3  a=  0.5054  sig=  0.07043  N=     3
   uv_056LU  zp= 4658.6  a= -0.4981  sig=  0.68491  N=     3
Back to calling page