Old Oct2018 lmap notes
Updated: Oct03,2018
In Sep2018 I organized a practical demonstration of lmap in the directory HET_work/Demo_lmap.
See .../HET_work/Demo_lmap for the command line structure. The actual LRS2 and acm images
are in ..../HET_work/HET_acm+lrs2/oct2017_sci.
This was done following work I did to optimize the
acm image search process that is used by lmap.
A detailed discussion of how lmap is used to map the relationship between
acm and LRS2 is in:    $scohtm/het+virus/lrs2/lrs2_point/index.html
Maybe this link gets you there.
In this example we use lmap to view the LRS2 data for observation=8 (note that I designated this as "008") and exposure=1
(note that I designated this as "01").
 |
|
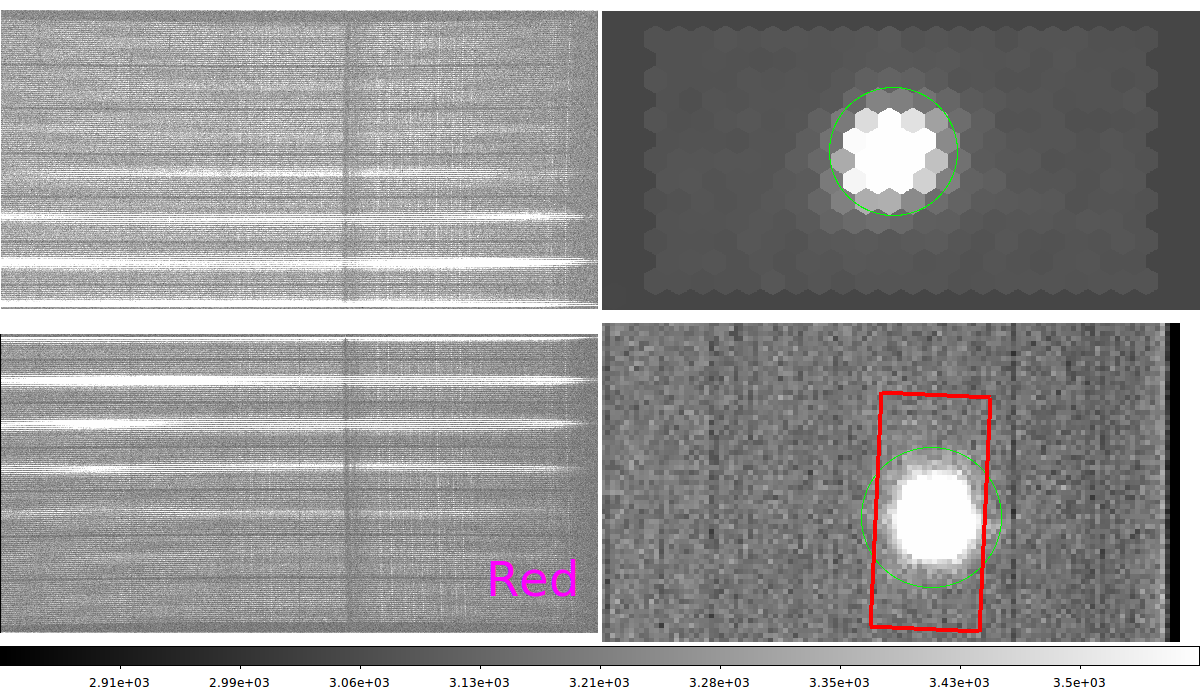
In the above example we have use lmap to view the Red channel in a set
of LRS2 data with observation=8 (note that I designated
this as "008") and exposure=1 (note that I designated
this as "01") with the command:
% lmap lmap 008 01 rd
The Red channel spectra are shown in the two left panels. The LRS2
spatial reconstruction is in the upper-right, and the acm view is in the lower-right.
Note that the green circles were draw by the user to measure the locations
of the star in the IFU and acm coordinate systems. For completenes I show
the BaseDir and Date files I used:
% cat BaseDir
/home/sco/HET_work/finding_charts
% cat Date
20170209
|
The final form of the output table from lmap is not set, but something like the
following information will appear:
Local LRS2 image = lrs2map.fits
Acam image       = 20170209T050520.4_acm_sci.fits
501.00 270.71            X,Y (in pixels) from map
725.64 571.67          X,Y (in pixels) from acam
 -0.162250 0.216972      X,Y (in  arcsec) from LRS2 map
008 01 rd 20170209     (obs,exp,channel,date)

Based on the LRS2 image, here is your correction to center the target:
mgp -toff=-0.162250,-0.216972

   501.00  270.71    725.64  571.67  -0.1623  0.2170   008  01  rd  20170209    20170209T050520.4_acm_sci.fits
Back to calling page