imstats_view
Updated: Oct17, 2018
This tool enables the user to mark boxes on an image realtime and view plots
of the pixel histograms. It makes major use of the routine
clip_imhist.sh. Some routines
are also used to fit the peak of each histogram to identify a robust
estimate of the background in each box.
% imstats_view ../20180403T075403.4_acm_sci_proc.fits N
Note that you can use a full path name for the image. A local image copy will be
retrieved and used for the run. The user is interactively given the choice of
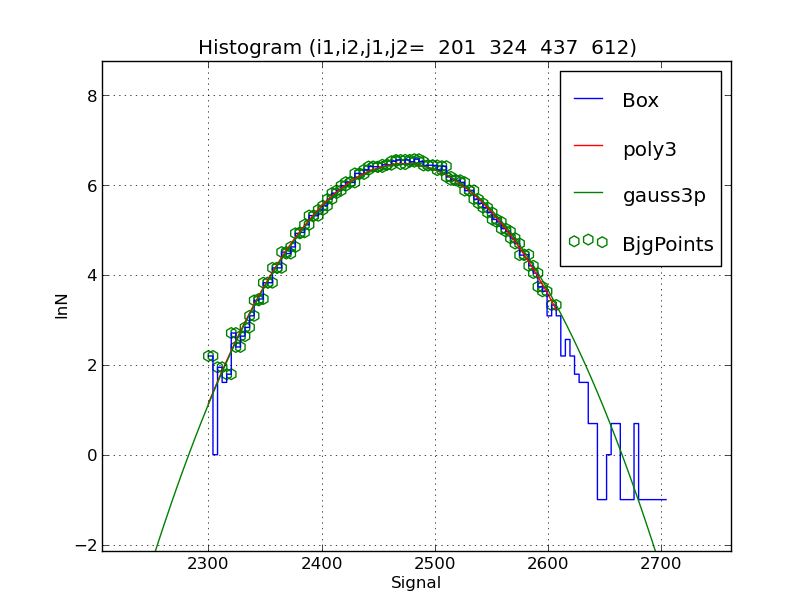
plotting each fitted histogram. A sample of such a plot is shown below.
 |
|
Sampel of a histogram for an image sub-region computed with imatst_view.
|
Sometimes we might like to see multiple histograms on one plot. This
can be done as demonstrated in the figure below.
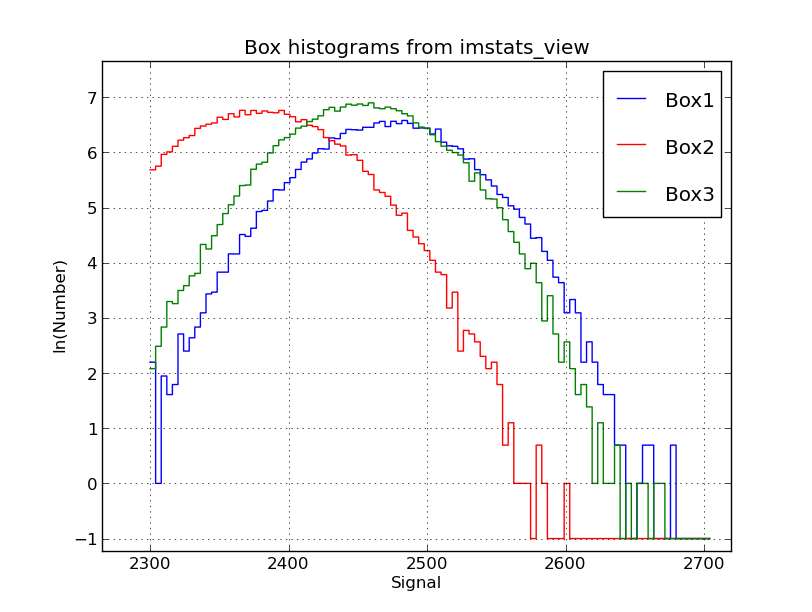 |
If you run the imstats_view routin in debug mode (last aregument is "Y") then
the histogram files, given unique names for each box, are preserved at the
end of the run. You can make a single plot that shows all of the histograms
as follows:
% cat List.0
clip_imhist.dat_box1    1 2 0 0       line       b - 70     Box1
clip_imhist.dat_box2    1 2 0 0       line       r - 70     Box2
clip_imhist.dat_box3    1 2 0 0       line       g - 70     Box3
% cat Axes.0
Box histograms from imstats_view
  2300.00000    2700.00000   Signal
    -1.00000       6.89669   ln(Number)
% xyplotter List.0 Axes.0
I just manually edit the List.0 file to specify the new file names and
change the color and label of each box.
|
Back