Improving gstar?
In late Jan2016 we began to experiment with allowing the
gstar user to customize certain parameters. Things like the
IHMP center, the use of an additive offset rotation angle, or the
multiplicative adjustment of an assumed plate scal could be
introduced to improve the performance of gstar.
- Introduction: The Problem.
- Example from a gstar run and observation.
- Systematic effects in gstar?
- Data from "2-star" setups on 20160204.
Introduction: The Problem.
As of Jan26,2016 we have used the gstar code several times to
place 2 guide stars onto the gc fields simultaneously. However,
the initial probe placements seem to position the guides stars
on the edge of the field. Some users have even noticed that systematically
placing the gstar "green circle" at a large radial distance instead just
on the star selected for a guide star in the DSS view will give
a better estimate of the final (Telecen_X,Telecen_Y) needed. Is this
due to a poor plate scale used by gstar or possibly other systematic
effects?
Example from a gstar run and observation.
Here we see an example of a gstar run for a field observed on 20160124.
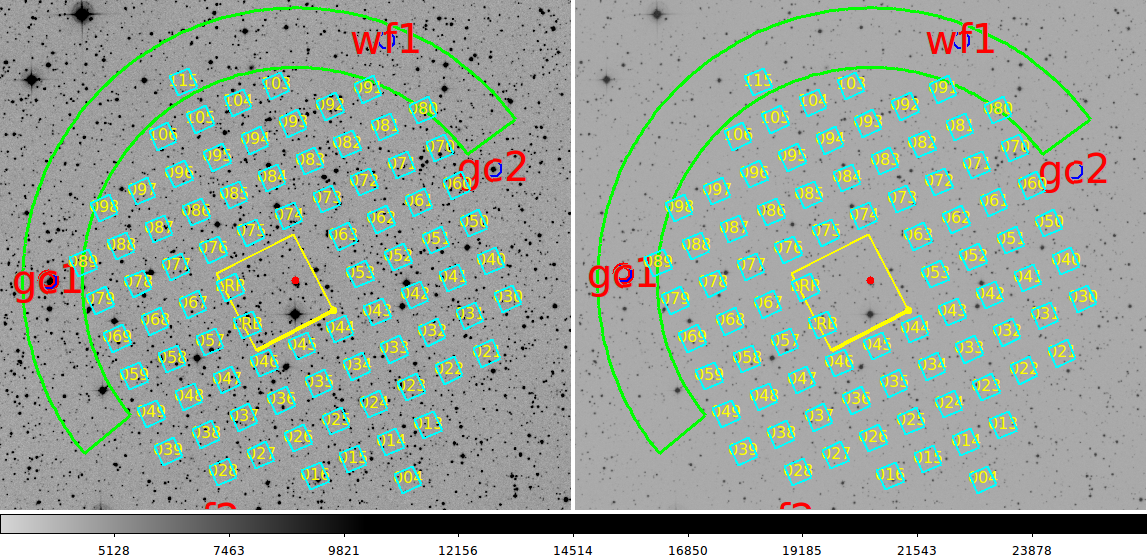 |
Results from two different gstar runs to select a gc2 star on the night
of 20160124. On the left is the original gstar run where our estimated
gc2 probe positions (from gstar) were [Telecen_X,Telecen_Y=+0.014,+0.150].
In the right panel we show a gstar run where we used a local
Probes.Current file to specify the final probe position that resulted
AFTER the RA had adjusted the gc1 values to place the star in the
observed gc1 field. That value was [Telecen_X,Telecen_Y = +0.011010,+0.152965].
Hence, at face value the two total offsets are then Roff = 0.1507 and 0.1534
degrees respectively (a difference in radial offset of about 0.3%).
In units of arcseconds the two Roff values are 542.5" and
552.2" respectively. Considering the field of view (fov) of
gc1,gc2 are about 19", this is a significant difference.
Which is correct? If we assume the probe coordinate system
is at the IHMP center, then we know:
IHMP center (G191B2B)    05:05:30.50 +52:49:57.0
guide star in gc2        05:04:37.60 +52:54:26.1  (from DSS)

I compute the difference via RD2XY (gnomonic projection):
% cat rd.gc2
05:04:37.60 +52:54:26.1

% RD2XY rd.gc2 05:05:30.50 +52:49:57.0
       478.567        269.837        549.398     299.416

% cat rd2xy_gnomSP.out_explain
Explanation of rd2xy_gnomSP output:
Col01 = X in arcsec (-X to East)
Col02 = Y in arcsec (+Y to North)
Col03 = Radius in arcsec
Col04 = position angle (degrees CCW from North towards East)
Hence, the computed offset of 549.4" is closer to our
"successful (Telecen_X,Telecen_Y) offset estimate of 552.2".
|
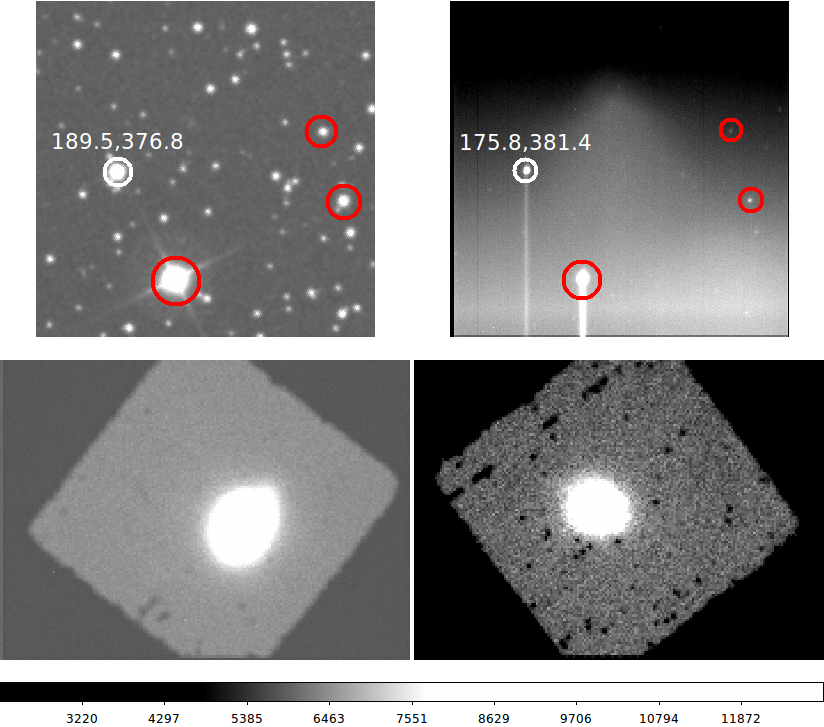 |
In the top two panels we see the "fake" acam image
made by gstar for our field (Left) and the real
acam image obtained on 20160124 (Right). Guide stars
for each probe were identified, and the gstar
gstar runs (and their outputs) to find the
Telecen_X,Telecen_Y for each probe were:
% gstar 05:05:30.60 +52:49:53.8 320.266 gc1
Ra,Dec,Az(IHMP):
05:05:30.60 +52:49:53.8 320.266
Telecen_X, Telecen_Y, (Ra,Dec)_probe, Probe_name:
0.07191 -0.14498 05:06:35.952 +52:49:53.95 gc1

% gstar 05:05:30.60 +52:49:53.8 320.266 gc2
Ra,Dec,Az(IHMP):
05:05:30.60 +52:49:53.8 320.266
Telecen_X, Telecen_Y, (Ra,Dec)_probe, Probe_name:
0.00949 0.15044 05:04:37.732 +52:54:27.30 gc2
Some manual adjustment of the probes (using small "pmove" runs)
were performed to better "center up" the stars in gc1 and gc2.
The final probe positions were found to be:
  0.071023  -0.147028   gc1
  0.011010   0.152965   gc2
On the bottom are the actual gc1 (Left) and gc2 (Right) images obtained
(after manual centering) at nearly the same time as the acam image.
We can see there is some difference between the predicted IHMP center
and where we ended up. This could have been due to the final placement
or tracker drift during the time we took to center the star in each
guide camera.
|
A simple analysis script. Following
the example in the first figure above, I have compiled some simple scripts that
produce useful numbers for judging our gstar resuls. Basically, we want to
know the angular sky separation between (Ra,Dec) positions on the sky. These
could be the IHMP center and a guider star position, or they could be the
two guide star positions. I use the ra_dec_offsets script for that:
Usage: ra_dec_offsets 10:45:10.90 +12:00:10.0  10:47:49.90 +12:34:57.0
arg1 - RA0 of projection center in sexigecimal format.
arg2 - DEC0 of projection center in sexigecimal format.
arg3 - RA (sexigecimal) of offset position.
arg4 - DEC (sexigecimal) of offset position.

Hence, for the gc1 probe above:
  Ra,Dec (IHMP)     =  05:05:30.60 +52:49:53.8
  Ra,Dec (gc1 star) =  05:06:35.952 +52:49:53.95

% ra_dec_offsets 05:05:30.60 +52:49:53.8 05:06:35.952 +52:49:53.95
      -592.243          1.272        592.245      89.877

% cat ra_dec_offsets.explain
Explanation of rd2xy_gnomSP output:
Col01 = X in arcsec (-X to East)
Col02 = Y in arcsec (+Y to North)
Col03 = Radius in arcsec
Col04 = position angle (degrees CCW from North towards East)
At this point, we would like to know how the above offset (592.2") compares
to that we would derive from the actual [Telecen_X,Telecen_Y = 0.071023,-0.147028]
we used to center the guide star in gc1. For this I use the (OTW)
routine called "xyoff.sh":
% telecen_offsets 0.00 0.00 0.071023 -0.147028
    255.6828    -529.3008      587.8206     -64.22
% cat telecen_offset.explain
# Standard output from xyoff.sh:
delX delY Separation Angle
#
# Angle conventions in xyoff.
1) Theta=0 is in +X axis direction.
2) Angles increase in POSITIVE sense CCW
3) Angles increase in NEGATIVE sense CW
4) Upper hemisphere --->  Theta runs 0 to +180 Degrees
5) Lower hemisphere --->  Theta runs 0 to -180 Degrees
Note that telecen_offset simply handles getting the input X,Y into
units of arcseconds, and then feeding these to xyoff.sh. Continuing this
madness, I create one final script, gstar_analysis_1, that computes the
two separations shown above and then computes the ratio of the two. This
is really what we are after: how do the sky (from DSS) and Telecen
coordinates compare. A significant difference will imply, in all likelyhood,
an error is plate scale somewhere in our gstar run sequence.
Usage: gstar_analysis_1 10:45:10.90 +12:00:10.0  10:47:49.90 +12:34:57.0   0.00 0.00  0.071023  -0.147028
arg1 - RA0 of projection center in sexigecimal format.
arg2 - DEC0 of projection center in sexigecimal format.
arg3 - RA (sexigecimal) of offset position.
arg4 - DEC (sexigecimal) of offset position.
arg5 - Telecen_X for point 1 (degrees).
arg6 - Telecen_Y for point 1 (degrees).
arg7 - Telecen_X for point 2 (degrees).
arg8 - Telecen_Y for point 2 (degrees).

% gstar_analysis_1 05:05:30.60 +52:49:53.8 05:06:35.952 +52:49:53.95 0 0 0.071023  -0.147028   592.245 587.8206 1.007527

% cat gstar_analysis_1.explain
# standard out from gstar_analysis_1:
sep1 sep2 ration
sep1 = separation in arcsec of Ra,Dec pairs
sep2 = separation in arcsec of Telecen pairs
ratio = sep1/sep2
Hence, in this final run, we learn that our two offsets agree
at the 0.7% level.
Systematic effects in gstar?
How can we visualize the systematic errors that we introduce in
location a guide star if have made an error in things like the
plate scale, the IHMP center position on the sky, or the estimated
HET structure azimuth? I have modifie gstar so that these quantities
can be modified (relative to default values) using local files
in the directory where gstar is run:
Introductory message when we run "gstar":

NOTE:
You can make a local file named Offset.Angle that contains
an offset rotation angle in degrees (0.5).

You can make a local file named IHMP.Position that contains
the X,Y of the IHMP in ACAM pixel coordinates (e.g. X,Y=174,382).

You can make a local Probes.Current to specify the probe
positions for gc1,gc2,wf1,wf2.
You can make a local Probes.Scale_Factor to change the probe
positions by a fixed scale factor (i.e. 1.000123).

Examples of files:
% cat Offset.Angle
0.00

% cat IHMP.Position
174. 382.0

% cat Probes.Scale_Factor
0.950000
 |
|
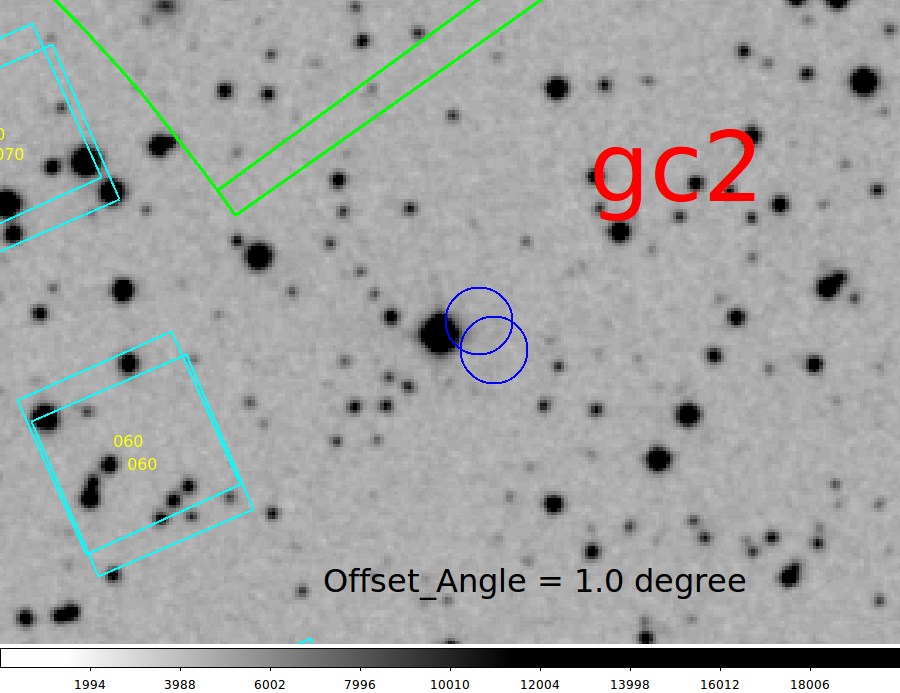
Change in Azimuth: If we change the
HET structure azimuth that is fed to gstar then we change the
parallactic angle we are to use. Hence, we cahnge the field rotation
we are dealing with when we overplot our IFU and guide probe position.
In the figure above I have combined the outputs from two gstar
runs. The only difference was that in the second case I have used
a local Offset.Angle value to assign an Azimuth offset of 1.0 degrees.
I have painted the guide probe positions in both cases as a BLUE
circle with a diameter pf 20 arcseonds. We see that a shift of 1 degree
in the estimate AZ (we usually deal with a few tenths of error in
most cases) will shift the apparent gc by about HALF
the size of a guide camera field of view (FOV).
|
 |
|
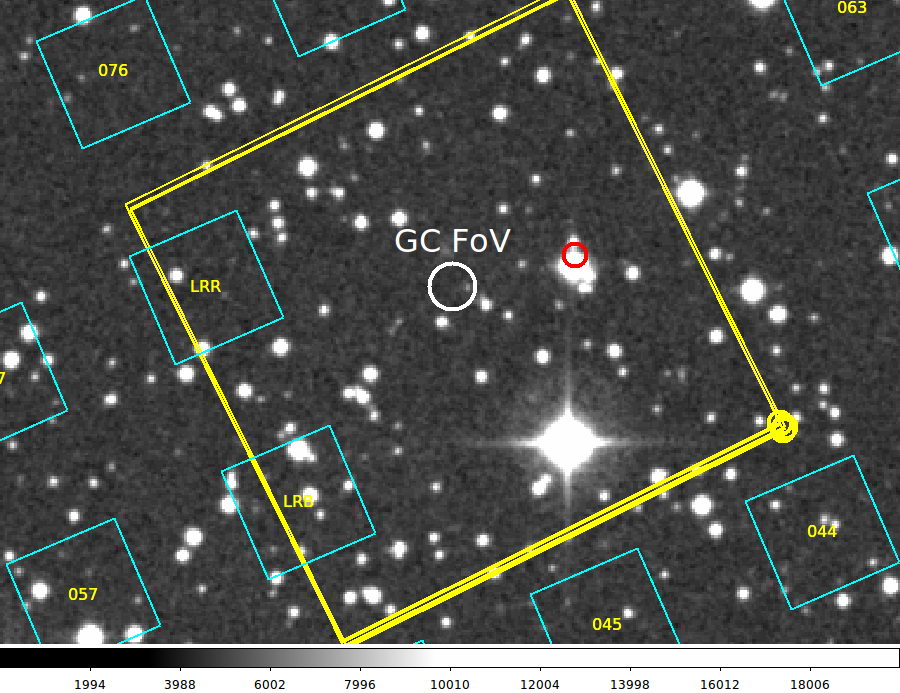
Change in IHMP X,Y on ACAM: Here we see
the effect of changing IHMP position on the ACAM. In the past we have used
three different ACAM positions: X,Y = (173,394), (178,391), and (174,382).
Each of these positions has been used in 3 different gstar runs. First,
We see that the placement of the red circle IHMP center is unchanged, as
are the IFU positions on the sky. This is to be expected because these are
set by the Ra,Dec inputs for the IHMP that we input to gster. By convention,
we are always assuming that we'll place the IHMP center on user-specified
position on the sky. How we achieve setting that position during the
observation is the "fake" ACAM image we make with our DSS image. Above
we see three slightly different yellow outlines, and these represent the
boundaries of the three different "fake" acam images that we made using
the 3 IHMP centers. For reference I have inserted a white circle that
represents the approximate field size of our guide cameras. Hence, using
the 3 different (X,Y)_IHMP values will move our field around an amount
indicated by the 3 sets of yellow acam field outlines. The changes are
relatively small compared to the size of out guide camear FoV.
However, if we combine this center offset with the
tracker drift we might see during the 5-10 minutes we take in centering
the guide stars in their respective cameras, we could build up an offset
which is comparable to the size of the gc FoV (or at least HALF of the
gc FOV).
|
 |
|
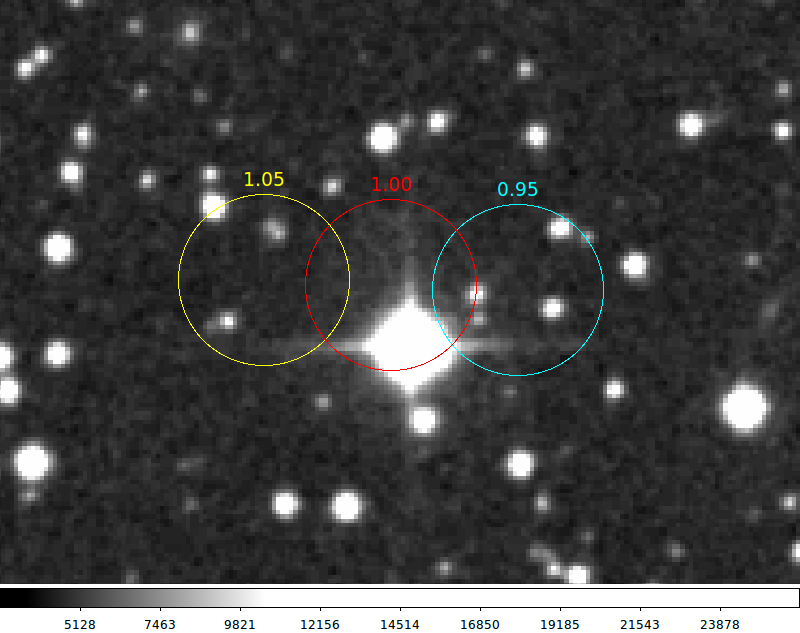
Change in plate scale:
Here we see the effect of change the scale or the
Telecen_X,Telecen_Y coordinates by 5%. The red circle
is the gc1 probe position with no scale applied. The yellow
circle represents a scale change of +5% (i.e. factor = 1.05) and
circle representa a scale change of -5% (i.e. factor = 0.95). In
all cases the circles have a diameter of 20" and hence represent
the approximate size of the active images areas of the guide probes.
Hence, a 5% error in our assumed WFC platescale will result in
a probe placement error comparable to the probe field of view (FoV)
on the sky.
|
Data from "2-star" setups on 20160204.
On 20160204 I collected a number of image sets for cases
where two guides stars were configured using gstar.
This file = /home/sco/ACAM/20160204/List.Fields_20160204.txt

Summary of 20160204 images I took for:
Test:  Setup guide probes with RA and DEC

  X,Y = Telecen_X,Telecen_Y that finally worked to center the stars in gc1,gc2

  The RA,DEC for the acam images are the bright setup star position we used. These
  are normally taken for htopx2. The RA,DEC for gc images are taken from DSS images
  via runs of the gstar code.

  On this night we kept all filters fixed:  ACAM=B  gc1=g  gc2=Clear
  EXPTIME was variable, but these values are in the headers.

  UT = Approximate UT when acam and gc images were collected.

                           ACAM images                             gc1 images                                     gc2 images
                 --------------------------------    -----------------------------------------   -----------------------------------------
Point  Name          RA            DEC        AZ        RA          DEC          X      Y           RA          DEC            X       Y        UT

 1    sao27466   09:59:50.214 +49:58:47.45  45.277   10:00:12.324 +49:50:20.41 +0.1510 +0.0160   09:59:28.914 +50:08:09.07 +0.0000 +0.0000   05:54
 2    sao81645   11:03:19.075 +23:22:36.52  92.682   11:03:30.589 +23:14:35.52 +0.1060 +0.0910   11:03:21.363 +23:31:16.23 +0.0000 +0.0000   06:11
 3    sao118463  10:44:33.427 +04:02:00.64 135.199   10:44:14.043 +03:54:25.78 +0.1387 +0.0550   10:44:53.433 +04:10:16.02 -0.1490 -0.0600   07:16
 4    sao136775  09:21:01.067 -03:32:50.63 192.261   09:20:24.520 -03:27:46.31 +0.1650 -0.0502   09:21:43.391 -03:31:48.74 -0.1700 -0.0511   08:03
 5    sao117308  08:57:49.966 +03:58:10.56 224.697   08:57:29.062 +04:06:08.65 +0.1500 -0.0485   08:58:13.061 +03:50:14.81 -0.1580 +0.0444   08:50
 6    sao80568   09:00:25.945 +24:29:47.39 269.467   08:59:49.784 +24:32:28.32 +0.0830 +0.1172   09:00:33.146 +24:21:12.76 -0.1440 +0.0179   09:48
With the information in the table above, I ran the floowing jobs:
% cat Run_gc1_only
#
gstar_analysis_1   09:59:50.214 +49:58:47.45  10:00:12.324 +49:50:20.41   0.0 0.0 +0.1510 +0.0160
gstar_analysis_1   11:03:19.075 +23:22:36.52  11:03:30.589 +23:14:35.52   0.0 0.0 +0.1060 +0.0910
gstar_analysis_1   10:44:33.427 +04:02:00.64  10:44:14.043 +03:54:25.78   0.0 0.0 +0.1387 +0.0550
gstar_analysis_1   09:21:01.067 -03:32:50.63  09:20:24.520 -03:27:46.31   0.0 0.0 +0.1650 -0.0502
gstar_analysis_1   08:57:49.966 +03:58:10.56  08:57:29.062 +04:06:08.65   0.0 0.0 +0.1500 -0.0485
gstar_analysis_1   09:00:25.945 +24:29:47.39  08:59:49.784 +24:32:28.32   0.0 0.0 +0.0830 +0.1172
% Run_gc1_only
  550.172 546.6431 1.006456
  506.478 502.9317 1.007051
  539.491 537.1447 1.004368
  626.092 620.8830 1.008390
  571.287 567.5255 1.006628
  519.132 517.0087 1.004107


% cat Run_gc2_only
#
gstar_analysis_1  10:44:33.427 +04:02:00.64  10:44:53.433 +04:10:16.02  0.0 0.0 -0.1490 -0.0600
gstar_analysis_1   09:21:01.067 -03:32:50.63 09:21:43.391 -03:31:48.74  0.0 0.0 -0.1700 -0.0511
gstar_analysis_1   08:57:49.966 +03:58:10.56 08:58:13.061 +03:50:14.81  0.0 0.0 -0.1580 +0.0444
gstar_analysis_1   09:00:25.945 +24:29:47.39 09:00:33.146 +24:21:12.76  0.0 0.0 -0.1440 +0.0179
% Run_gc2_only
  578.784 578.2568 1.000912
  636.686 639.0503 0.996300
  588.059 590.8319 0.995307
  523.950 522.3897 1.002987


% cat Run_gc1+gc2
#
gstar_analysis_1  10:44:14.043 +03:54:25.78   10:44:53.433 +04:10:16.02    +0.1387 +0.0550  -0.1490 -0.0600
gstar_analysis_1  09:20:24.520 -03:27:46.31   09:21:43.391 -03:31:48.74    +0.1650 -0.0502  -0.1700 -0.0511
gstar_analysis_1  08:57:29.062 +04:06:08.65   08:58:13.061 +03:50:14.81    +0.1500 -0.0485  -0.1580 +0.0444
gstar_analysis_1  08:59:49.784 +24:32:28.32   09:00:33.146 +24:21:12.76    +0.0830 +0.1172  -0.1440 +0.0179
% Run_gc1+gc2
  1118.202 1115.3976   1.002514
  1205.499 1206.0044   0.999581
  1159.007 1158.1398   1.000749
   898.352  891.9684   1.007157
Form these results, particualarly the gc1+gc2 runs, it would appear that a
difference in plate scale is not extremely big problem at the > 0.1% level.
Back to gstar page