gen_noise
Updated: Dec27,2018
Generate data noise values using random or gaussian distribution. I also show
some simple examples using the unix paste command to generate into data files.
Here is the basic call, followed by various examples of using the code.
A really dumbshit thing that I forget sometimes is how importnat it
is to use the "seed" file and the sleep utility when generating two sets of data
so the I do not get correlated noise sets. Be sure to look over the examples below!
% gen_noise.sh
Usage: gen_noise.sh gaus 10 10.0 2.0
arg1 - type of distribution (rang,gaus)
arg2 - number of points
arg3 - xmin if rand,  if gaus
arg4 - xmax if rand, sig if gaus

% gen_noise.sh gaus 10 10.0 2.0
    11.28645
     8.29654
    11.58986
    12.38048
    10.41163
     8.84070
     8.76075
     7.77484
    10.04731
    10.69495
- Making a file of 2-D gaussian noise.
- A fancier 2-D file with timing measures.
- A quick ipython plot.
- Data for my interactive cursor routine.
A file of 2-D gaussian noise.
This routine is usually used to generated noise that
is added to one or more axes in a set test data. Here
I gebnerate two sets of data. I combine them with the
unix "paste" command to make a "standard table file"
that I can fit or display with a number of packages.
%  gen_noise.sh gaus 10 10.0 2.0 >a
%  gen_noise.sh gaus 10 12.0 3.1 >b
%  paste a b >final
%  cat final
    11.28645        13.99400
     8.29654         9.35964
    11.58986        14.46428
    12.38048        15.68974
    10.41163        12.63803
     8.84070        10.20309
     8.76075        10.07916
     7.77484         8.55101
    10.04731        12.07332
    10.69495        13.07718
A fancier 2-D file with timing measures.
In a more complicated example I wrote what is still a
fairly simple script. The script to generate data and
some supporting scripts for viewing the results are in
my TDATA directory: $tdata/T_runs/gen_noise/ex0 (used to
be gendata).
I generate a set of N points (X,Y,Rad) and then transform
them with circles_trans.sh. I generate a ds9 regions file
with circles_file_ds9.py. In addition, I added some simple
timing calls that allow me to time how long it takes to
handle different numbers of points
#!/bin/bash

# Generate gaussian point distributions at the
# Origin (0,0) using sigmas of $2 and $3
# Rotate the points 30.0 degrees, apply a scale=2.5
# and translate the points to X,Y=1000,1100

if [ -z "$1" ]
  then
    printf "Usage: ex2.sh 10 100 115  \n"
    printf "arg1 - number of points\n"
    printf "arg2 - sigma for X set \n"
    printf "arg3 - sigma for Y set \n"
    exit
fi
if [ -z "$2" ]
  then
    printf "Usage: ex2.sh 10 100 115  \n"
    printf "arg2 - sigma for X set \n"
    exit
fi
if [ -z "$3" ]
  then
    printf "Usage: ex2.sh 10 100 115  \n"
    printf "arg3 - sigma for Y set \n"
    exit
fi

date >seed
gen_noise.sh gaus $1 0.0 $2 >a
sleep 2
gen_noise.sh gaus $1 0.0 $3 >b
gen_noise.sh gaus $1 10.0 0.2 >c
echo "# data" >d
paste a b c >e
cat d e >test.1
# Time the translation and region file make
dspit a 1
dsep tstamp.a_1 > Time.Start
circles_trans.sh test.1 30.0 2.5 1000.0 1100.0 >f.pix
circles_file_ds9.py f.pix red 2 >t1.reg
dspit a 2
dsep tstamp.a_2 > Time.End

# clean up
\rm -f a b c d e f.pix ttt seed
To run 50000 points with this script takes about 4 seconds, and
2 seconds of that is a "sleep 2" task used to prevent correlated
random noise. Notice above that I have also added the (dspit,dsep)
calls, and these create local time stamp files. Using N=50000
points I see that the transformation and region files are computed
in less that 1 second:
% make_gauss_noise 50000 100 100

% cat Time.End Time.Start
79241
79241

% cat tstamp.*
Sat Jul  4 22:00:41 UTC 2015
Sat Jul  4 22:00:41 UTC 2015
Clearly, the question of point processing times for the VIRUS
applications will probably not be important.
In this TDATA example I also have a couple simple scripts for grabbing
an image (S/grab1) and then displaying the results (lookit). In short,
the following three commands should give us a ds9 picture:
% make_gauss_noise 10000 100 115
% grab1
% lookit

% cat lookit

#!/bin/bash
ds9_open 800 800
imlook n3379_B.fits 50.0
xpaset -p ds9 zoom to fit
cat t1.reg | xpaset ds9 regions -format ds9
A quick ipython plot.
This is a bit of a diversion, but in Jun2016 I began to
buckle down and us ipython as much as possible. I can use matplotlib
in ipython to inspect my gaussian data sets from the above example:
% < ipython
Python 2.7.4 (default, Sep 26 2013, 03:20:26)
Type "copyright", "credits" or "license" for more information.
IPython 2.3.1 -- An enhanced Interactive Python.
? -> Introduction and overview of IPython's features.
%quickref -> Quick reference.
help -> Python's own help system.
object? -> Details about 'object', use 'object??' for extra details.
Here are my commands in ipython:
from scomods.ascii_tools import *
x = read1col('1','test.1')
y = read1col('2','test.1')
import matplotlib.pyplot as plt
plt.plot(x,y,'ro', markersize=2, label='Set 1')
plt.xlabel('X')
plt.ylabel('Y')
plt.title('My gaussian test data')
plt.legend(loc=1)
plt.show()
In the figure below I show my plot. Note that I used the
"double-arrow" icon to slightly adjust the scale and
zero-point of each axis in the plot.
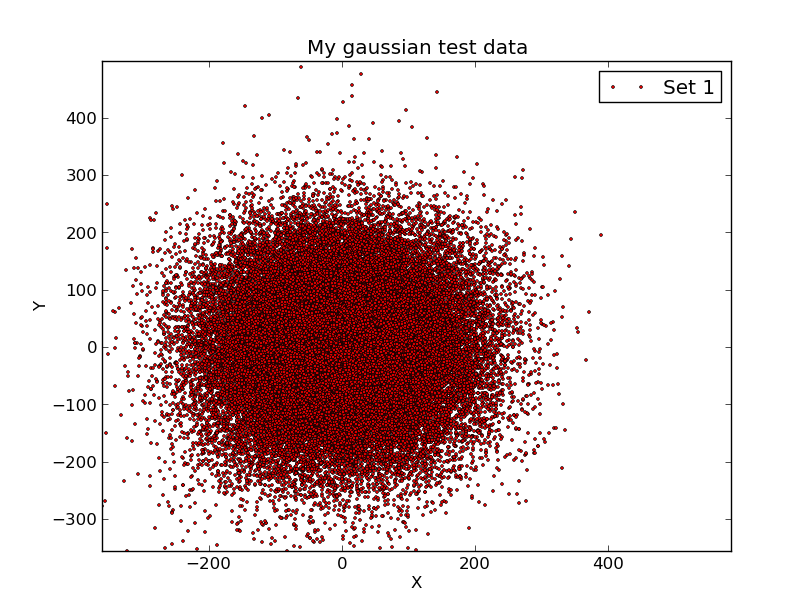 |
Here I have used ipython to make a quick (and easily
adjustable) plot of my test.1 data from the run
of make_gauss_noise discussed in my second example.
Here are the commands I used in ipython:
from scomods.ascii_tools import *
x = read1col('1','test.1')
y = read1col('2','test.1')
import matplotlib.pyplot as plt
plt.plot(x,y,'ro', markersize=2, label='Set 1')
plt.xlabel('X')
plt.ylabel('Y')
plt.title('My gaussian test data')
plt.legend(loc=1)
plt.show()
|
Data for my interactive cursor routine.
Notice how I use the seed file and the sleep utility.
Here is some code I use to generate test data for my interactive cursor code:
% cat MakeXY
#!/bin/bash
printf "Enter number of points you want (16): "
read npoints
echo "I use a new seed" > seed
# generate the X column
gen_noise.sh gaus $npoints 6.0 2.0 > a1
data_strip a1
mv data_strip.table A1
\rm -f data_strip.header data_strip.out data_strip.table
# generate the Y column (after a sleep to get a new seed for random numbers)
sleep 5.0
gen_noise.sh gaus $npoints 8.0 3.0 > a1
data_strip a1
mv data_strip.table A2
\rm -f data_strip.header data_strip.out data_strip.table
# generate the column of 0 flags
column_fake $npoints " 0 " > A3
# Make the line numbers
namelist $npoints > A4
# paste the columns AND (VERY IMPORTANT) remove the tabs
paste A1 A2 A3 A4 > B
cat B | tr -d '\t' > Btemp
printf "Title line\n" > xyf.in
printf "X label\n" >> xyf.in
printf "Y label\n" >> xyf.in
cat Btemp >> xyf.in
\rm -f a1 A1 A2 A3
To run the code:
% ./MakeXY
Enter number of points you want (16): 800
# This created the file named "xyf.in"
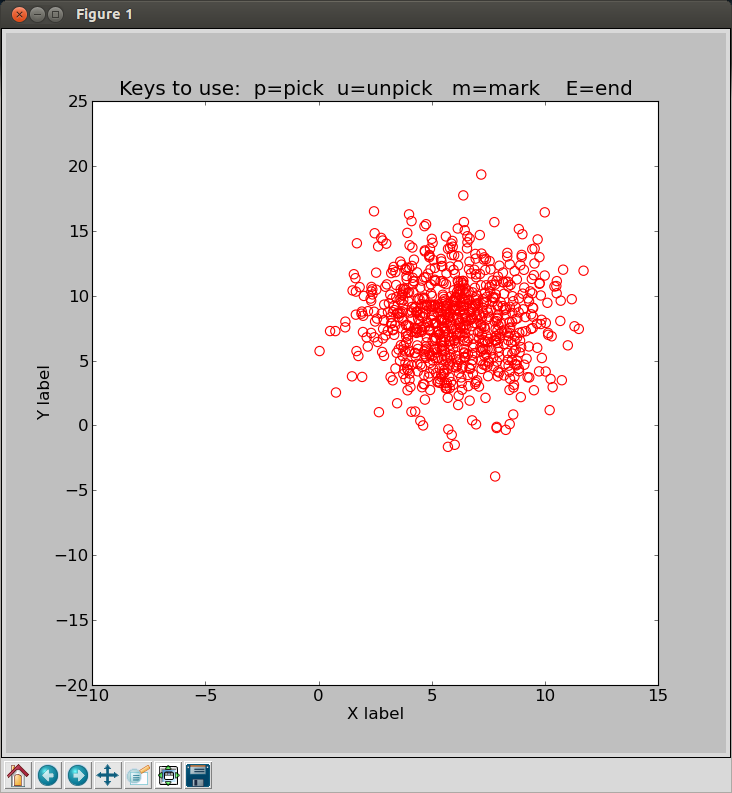
# To see the 800 points with my cursor routine:
% icurs4.py
 |
|
The icurs4.py run of the 800 points I generated using gen_noise.sh.
|
Back to SCO CODES page