Apr2020 apphot working notes
Updated: Apr20,2020
A test image is in:
  /home/sco/ACM_work_Oct2019/red_20191022/local_red/WCS/20191022T025524.2_acm_sci.fits

For access to the local_red subdirectories I have to run the code from:
  /home/sco/ACM_work_Oct2019/red_20191022

To run the ds9_imstats code on this image (from anylocation):
% pwd
/home/sco/ACM_work_Oct2019/red_20191022/play1
% ds9_imstats /home/sco/ACM_work_Oct2019/red_20191022/local_red/WCS/20191022T025524.2_acm_sci.fits N
% ls
20191022T025524.2_acm_sci.cdfp	20191022T025524.2_acm_sci.info	bkg_annuli.reg
20191022T025524.2_acm_sci.fits	20191022T025524.2_acm_sci.reg

To run apertures I use apphot:
% ls
 aps1.cdfp
% apphot ../local_red/WCS/20191022T025524.2_acm_sci.fits aps1.cdfp 3.0 APER1
****  Please wait, mido.sh is computing images parameters.
% ls
20191022T025524.2_acm_sci.fits	APER1.parlab  APER1.reg  APER1.table  aps1.cdfp

Usage: apphot 20191022T025524.2_acm_sci.fits aps1.cdfp 3.0 AP1
arg1 - FITS image to be measured
arg2 - name of the cdfp file containing aperture position (Xcent,Ycent)
arg3 - aperture radius in units of arcseconds
arg4 - basename for the output table file
Additional options:
     -v = print verbose comments
 --help = view a help document

To get a list of RamDec from the cdfp file and paste into the mido table I used:
cdfp_rdlists.sh  aps1.cdfp

After a run of apphot we have files like:
% ls
20191022T025524.2_acm_sci.fits  APER1.parlab  APER1.table
APER1.cdfp                      APER1.reg     aps1.cdfp

We can view the apertures with:
% ds9_open 950 950
% ds9_view 20191022T025524.2_acm_sci.fits zscale n 1
% cat APER1.reg | xpaset ds9 regions -format ds9

We could see all of the detections with:
% cat 20191022T025524.2_acm_sci.cdfp.reg | xpaset ds9 regions -format ds9
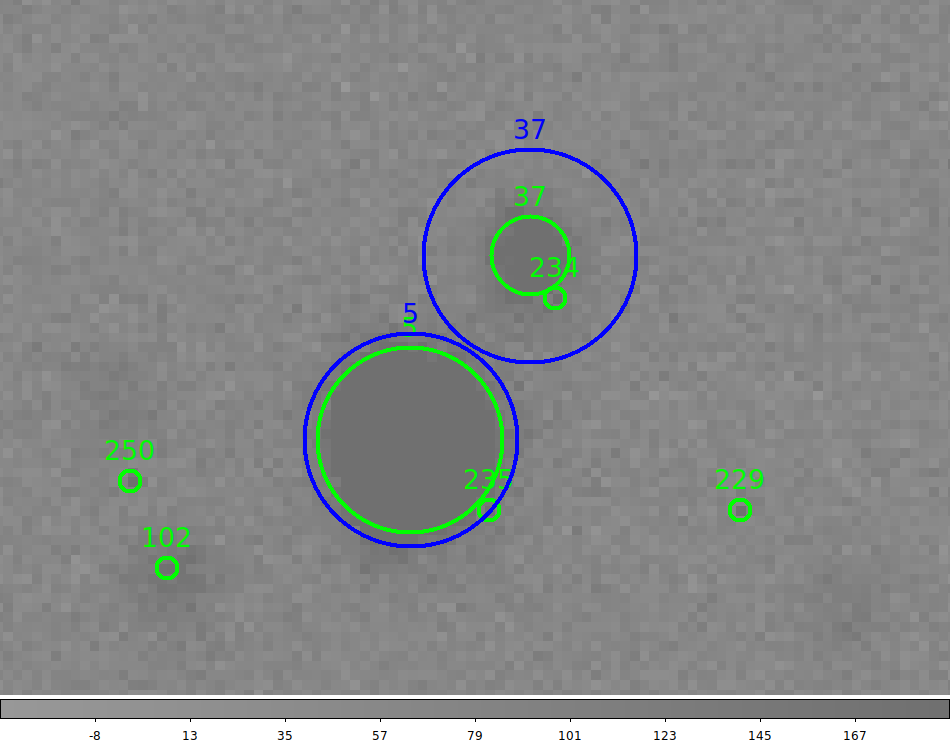
An example of using these ds9 region markers is shown in the figure below.
 |
|
Here we see two sest of ds9 regions overplotted on the
FITS image used in our example (20191022T025524.2_acm_sci.fits). The
green circles are detections taken from the imgcat0 catalog (compiled
with image_catalogs). The green circle radii are computed using the number of
pixels in each detection established with threshholding. The blue circles are
the apertures (radius = 3 arcseconds) measure by the apphot routine. Note that
in gathering the sources to be measured with apphot (this step performed with
photom2_prep) we imposed a cut in the NumPix values. Only sources with at
least 8 pixles were gathered for measurement. This is why we see only two
blue sources (for sources 37 and 5).
|
Next we want to gather the PS1 data for this field and overplot it also.
To find the gri data set we need for calibration
% dssbase_list Y               # sets up summary files in ./local_red/Store_DSS

% basic_fits_info ../20191022T025524.2_acm_sci.fits
 ___ g` 19:44:18.413 +26:13:38.27 272.846497 253.334151 5    (object,filter,ra,dec,az,parang,exptime)

% dssbase_locate 19:44:18.413 +26:13:38.27 5.0         (# Use Ra,Dec from above, and search radius in arcmin)
*** The answer is in the file Best.DSS
% cat Best.DSS
dss_RA19c44c11p555DEC+26c13c43p51_475

What is in Best.DSS   --- The basename of the best DSS set for this field
% ls ./local_red/Store_DSS/dss_RA19c44c11p555DEC+26c13c43p51_475*
./local_red/Store_DSS/dss_RA19c44c11p555DEC+26c13c43p51_475.fits
./local_red/Store_DSS/dss_RA19c44c11p555DEC+26c13c43p51_475_ps1.cdfp
./local_red/Store_DSS/dss_RA19c44c11p555DEC+26c13c43p51_475_usno_all.cdfp
Hence, our gri data are in:   ./local_red/Store_DSS/dss_RA19c44c11p555DEC+26c13c43p51_475_ps1.cdfp

To make a regions file for the PS1 data:
% cp ./local_red/Store_DSS/dss_RA19c44c11p555DEC+26c13c43p51_475_ps1.cdfp P.cdfp
% printf "g\n" > extra.quantity
% cdfp2reg.sh P.cdfp -5.0 cyan any any
*** The regions file is named P.cdfp.reg

# Hence to view the whole big batch of stuff:
% ds9_open 950 950
% ds9_view 20191022T025524.2_acm_sci.fits zscale n 1
% cat P.cdfp.reg  | xpaset ds9 regions -format ds9
% cat APER1.reg | xpaset ds9 regions -format ds9
% cat 20191022T025524.2_acm_sci.cdfp.reg | xpaset ds9 regions -format ds9
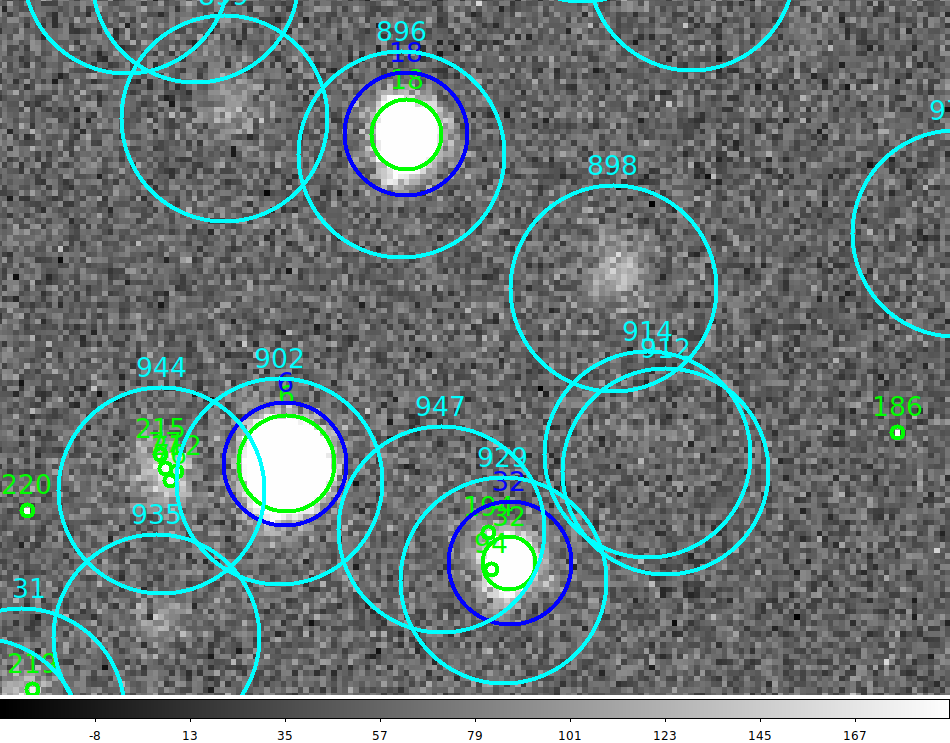 |
|
Here we see plot like above, but we have added a regions file that shows
(in cyan) the PS1 (PANSTARRS) g magnitude sources. Here we see that the
PS1 catalogs generally go much fainter than we need. The three sources
for which we got apphot data for (in Blue) all have corresponding PS1
data (in cyan). There is some evidence of a systematic positional shift of about
0.5 to 1 arcseconds. The source of this shift is unknown at this time but may reflect
a differnce between the USNO and PS1 astrometric systems.
|
Back to calling page