A routine that enables the user to make a graphical determination of the
IHMP center position i the acm coordinate system. The input file contains
XY positions in the IHMP system (from the fplane.txt file) and XY in the
acm system from measurements made with codes like lmap and the ds9. The four
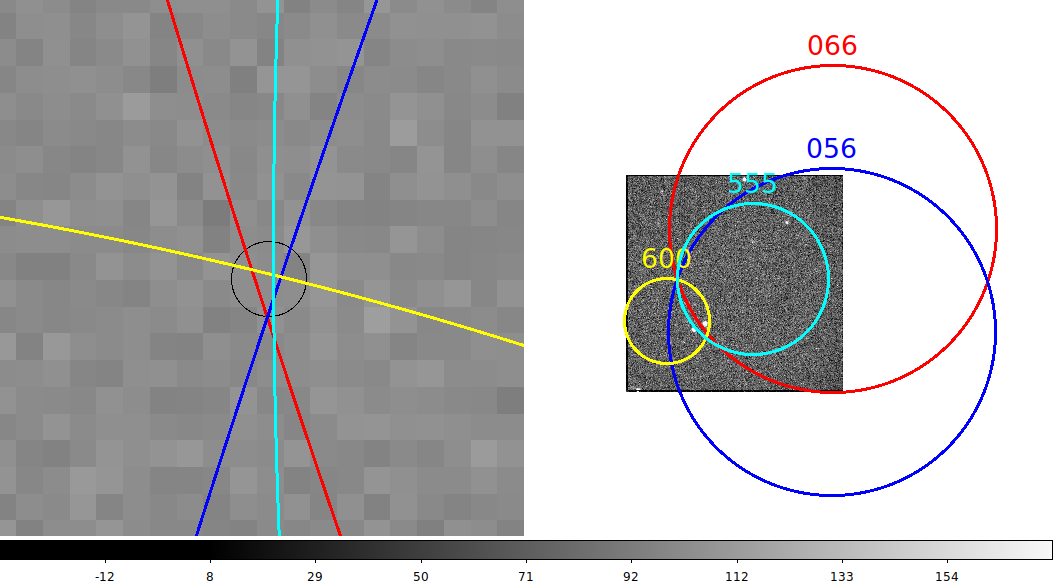
detector positions measured are for 056=LRS2B, 066=LRS2R, 555=BIB, and 600=HPFacq.
% acm_xy_graphical -h

usage: acm_xy_graphical Data.ALL  [-v] [-h]
arg1 = date the bias images were taken
Additional options:
 -v = print verbose comments and run in debug mode
 -a = specify a custom acm FITS image
 -h = just show usage message

% cat Data.ALL
# IHMP-acm positions after Sep2018 FPA take-down
# name     X,Y_ihmp         X,Y_acm      X,Y_acm _prev
# data
555       0.7  -73.1     455.0  398.7    455.0  398.7
600     -39.9   9.97     148.7  250.3    148.7  250.3
056     -50.0 -150.0     738.6  211.6    738.6  211.6
066      50.0 -150.0     739.7  577.3    739.7  577.3

%  acm_xy_graphical Data.ALL -a a.fits
Result from acm_xy_graphical:
acam_x_origin  =  184.71  -+  2.16   (acm pixels)
acam_y_origin  =  397.35  -+  2.16   (acm pixels)
In the example above we have renamed a typical acm image to be "a.fits" and
moved it into the local working directory. If the "-a" is not used to read a custom
image then one is pulled from the critical_files directory. A typical run is shown
below where I have opened a second ds9 windo with a wider zoon field of view to
show the radial extent of each detector used in the derivation.