I have assembled 107 reduced acm images in /home/sco/acm_SBSKY. These are
from 16 nights during Feb,Mar,Apr,May of 2019. I have included a few nights
where the moon illumination was around 50% so that we can begin to look at
the sky brightness function associated with moon phase and angle. In addition,
in late April and May, I began to notice the presence of Gunn r filter images
taken with the acm. Hence, in this analysis I'll change up the assembly of the
acm data table file. I'll look into generalizing the use of some of the table
manipulation and plotting tools.
Here I want to concentrate on building a script that sets up the initial g,r,i tables.
Then I want to make plots and compute stats witj various table/plotter tools in
oder to investigate systematics in the g image data.
Two new major scripts:
acm_pupil_data == assemble a table file of PUPILLUM values from image headers.
Uses acm_pup to convert (X_STRT,Y_STRT) to RSTRT.
acm_pupil_cal == assemble puil illumination values predicted from ZPSEC values.
This script uses fits2table to gathe WAVELEN and ZPSEC values from the
FITS headers of images listed in a an input file.
For each image values of con.ZPSEC,WAVELN are written to ZP.data
The ZP.data file is then processes by acm_pupcal.sh to compute the
final pupil illumination values from ZPSEC. The values are written
to "Pupil.Values" and this file should have the same number of lines
as are in the input list.
The images are in: /home/sco/acm_SBSKY (see list.03)
I do analysis 03 in: /home/sco/acm_reds_sco2019/Analyses/Analysis03/data
% ls -1 /home/sco/acm_SBSKY/*fits > list.03
I make a table file with fits2table. Here is the PARAMS The PARAMSfile is
what determine what will be assembled i the table files.
% cat PARAMS
WAVELEN Filter wavelength (angs)
UTHOURS Hours since 0hUT
UTDATE UT date (YYYYMMDD)
RSTRT Radius position of tracker at start (mm)
AZHET HET structure AZ (deg)
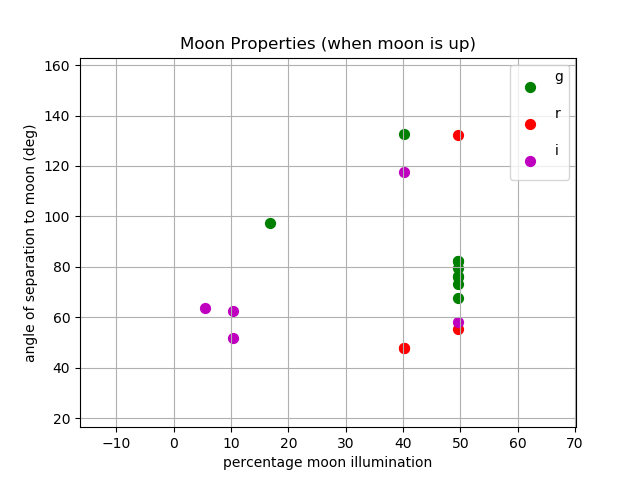
MILLUM percentage moon illumination
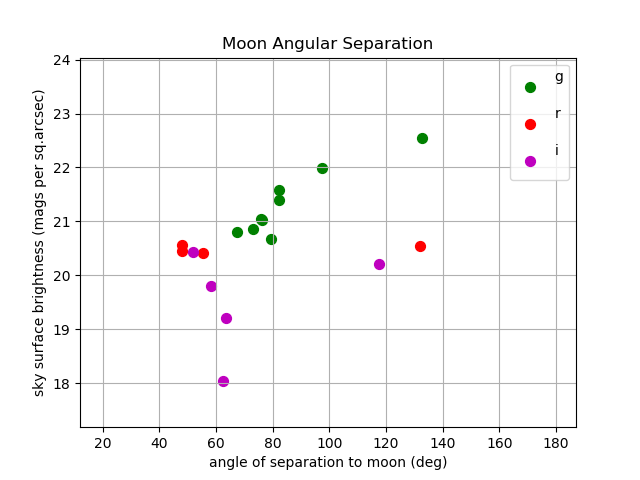
PHIMOON angle of separation to moon (deg)
ZPSEC ZP for a 1-sec exposure
ZPERR mean error of ZPSEC
SKYSB sky surface brightness (mags per sq.arcsec)
SKYSBERR mean error of SKYSB
To get tables:
% ACM_ANALYSIS_TABLES list.03 PARAMS N
I get the A1 table, and found 5 bad points out of the 107. I removed these
and ran again.
/home/sco/acm_SBSKY/20190512T073909.7_acm_sci.fits
/home/sco/acm_SBSKY/20190205T121618.8_acm_sci.fits
/home/sco/acm_SBSKY/20190307T081109.3_acm_sci.fits
/home/sco/acm_SBSKY/20190207T111542.6_acm_sci.fits
/home/sco/acm_SBSKY/20190409T100822.5_acm_sci.fits
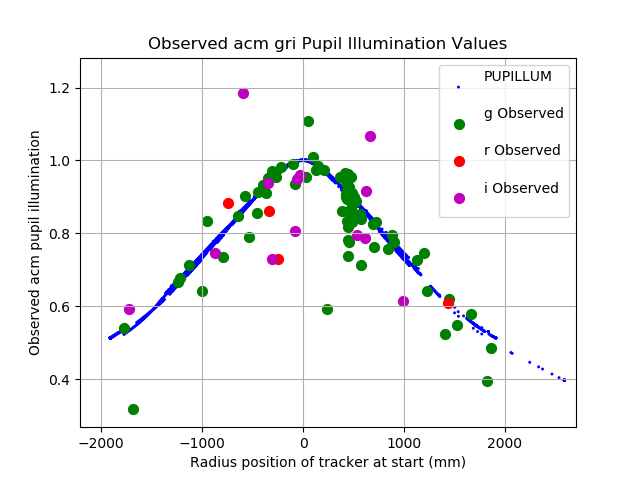
Make a nice plot:
% Generic_Points N # edit "xyplotter_auto.pars"
% xyplotter_auto datg RSTRT ZPSEC 20 N # edir List.20 , Axes.20 hereafter
% xyplotter_auto dati RSTRT ZPSEC 20 N # edir List.20 , Axes.20 hereafter
Then I added the PUPILLUM data and made a final plot (List.20, Axes.20)
This plot was made in: /home/sco/scohtm/scocodes/Night_of_acm/Analysis/analysis03/data
All of the compoent files are stored in:
/home/sco/scohtm/scocodes/Night_of_acm/Analysis/analysis03/data.Fig_Pupil_1
To re-run the plot:
% xyplotter List.20 Axes.20 N
Note: I currently leave out the PUPILLUM values fro the 16 nights. These
are in: ACMPUPIL0.table
The ACMPUPIL.table has more points but is only from the first 9 days or
so of Jan2019. The acm_pupil_data script runs very slowly on mcs and I
could not get any more pupil data.
Basic results are illustrated below.
Most of the data reduced thus far were near moonless nights. I have
some g data when the moon was 50% illuminated, and I can see a trend in
sky syrface brightness and moon angle (see figure below). I need more
data from nights with moonlight. One immediate stratgey would be to reduce
a lot of nights where the moon phase is close to 50%. At some stage I may
be able to correct for moon phase and sky color (i.e. normalize all filters to
on system) and derive a single set of data points for sky brightness verses
anular sparation, but we'll need a lot more acm images to validate this approach.