In the Apr2019 I revised the acm reductions to the point where most of the
useful data is in the headers. Here I describe a simple analysis of 6 nights.
This is really just a sanity check of the header info before I reduce more
nights. I still have to remove some images taken outside
of the 18deg twilight limits.
NUT dates of nights: 20190204 20190205 20190207 20190304 20190307 20190409
The images are in: /home/sco/acm_SBSKY (see list.0)
% ls -1 /home/sco/acm_SBSKY/*fits > list.0
Cards of interest:
IMGTYPE = open /Type of image (bias,dark,open)
WAVELEN = 7480.0 /Approximate central wavelength (angs) of filter
UTHOURS = 11.72125 /Hours since 0hUT
UTSECS = 42196.5 /Seconds since 0hUT
DAY2000 = 7036.988281 /Days since 0hUT Jan1 Year=2000.0
DJAN1 = 98.488388 /Days since 0hUT Jan1
UTDATE = 20190409 /8-character UT date (YYYYMMDD)
UTTIME = 114316.5 /8-character UT time (hhmmss.s)
RAWCMED = 1400.2748 /Pixel median
RAWCSIG = 46.9045 /Pixel standard deviation
FBPCOR = Y / fixed bias pattern correction applied (Y/N)
BIASMEAN= 1387.9854 / mean bias subtracted
BIASSIG = 0.0422 / stan.dev. of bias among images
AZHET = 43.4135 / HET structure AZ (deg)
HETQ = 69.6001 / HET parallactic angle (deg)
POSANG = 340.3900 / 360-CROTA2 (tzcal.sh,old)
TZ = 270.7900 / PA-HETQ (tzcal.sh,old)
ZPSEC = -2.3280 / ZP for a 1-sec exposure
ZPERR = 0.0042 / mean error of ZPSEC
NUMZP = 3 / number of calbrating sources
PSYSNAMe= g / name of photometric system
RSTRT = 480.5498 / Radius position of tracker at start (mm)
MILLUM = -99.0000 / percentage moon illumination
PHIMOON= -99.0000 / angle of separation to moon (deg)
VSKYSB = 21.9000 / predicted V sky surface brightness
SKYSB = 22.3838 / sky surface brightness (mags per sq.arcsec)
SKYSBERR= 0.0038 / mean error of SKYSB
NUMBOX = 5 / number of sky boxes measured
I make a table file with fits2table. Here is the P.file:
% cat P.file
WAVELEN Filter wavelength (angs)
UTHOURS Hours since 0hUT
UTDATE UT date (YYYYMMDD)
RSTRT Radius position of tracker at start (mm)
AZHET HET structure AZ (deg)
MILLUM percentage moon illumination
PHIMOON angle of separation to moon (deg)
ZPSEC ZP for a 1-sec exposure
ZPERR mean error of ZPSEC
SKYSB sky surface brightness (mags per sq.arcsec)
SKYSBERR mean error of SKYSB
I make table A1
% fits2table list.0 P.file A1 N
% ls
A1.images A1.params A1.parlab A1.table list.0 P.file S/
I split A1 into a g,i tables using WAVELEN: 4686.0 (g) 7480.0 (i)
To make separate files for g,i:
% cp A1.parlab datg.parlab
% cat A1.table | grep 4686.0 > datg.table # insert "# data"
% cp A1.parlab dati.parlab
% cat A1.table | grep 7480.0 > dati.table # insert "# data"
To make initial plots
% xyplotter_auto datg q q 10 N
Here is the xyplotter_auto.pars file I used:
% cat xyplotter_auto.pars
PointType E
PointColor b
LegendName g
SymbolType o
Psize 50
===========================================================================
To plot g,i data together:
% xyplotter List.10 Axes.10 N
% cat List.10
datg.table 9 11 10 12 errorbar b . 1 g
dati.table 9 11 10 12 errorbar r . 1 i
% cat Axes.10
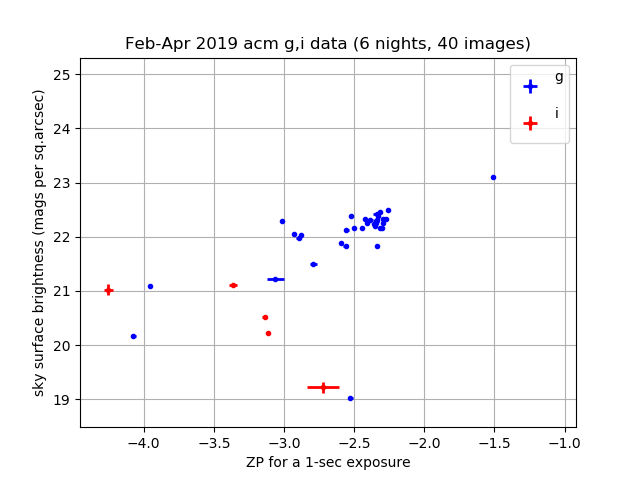
Feb-Apr 2019 acm g,i data (6 nights, 40 images)
-4.07340 -1.50670 ZP for a 1-sec exposure
19.03120 23.09970 sky surface brightness (mags per sq.arcsec)
===========================================================================
To get mean g values
% point_selector datg ZPSEC SKYSB N # create xyf.in
% point_selector_stats.sh xyf.in Y 0 N
22.28681 22.28850 0.10403 0.02270 21 (mean,mediam,sig,me,n)
Hence, the mean g sky surface brightness: 22.29 -+ 0.03 mss (21 images in new moon, clear skies)