Determining a redshift for NGC1262 with VIRUS-P data
Inception date: Mar17,2023
Last updated: Mar28,2023
Jump to bottom of page
Primary List
- Introduction.
- Using an old GregZ code for LRS2-B.
- Using ds9 directly.
- Using ds9 to make a regions file for apertures.
Introduction.
A set of VIRUS-P observation of NGC1262 with VIRUS-P were made by Ann Isaacs
in late November of 2022.
See sco2019 data files in:   /home/sco/VIRUS-P
% ls
ifumap.txt  NGC1262_cube/  raw_data/  README.NGC1262  README.sco  VP_fiber_mapping.txt

Some NGC1262 basic information
------------------------------
Name_RC3       RA_2000    DEC_2000     Type     Input_name
-----------  ----------- ----------   ------    ----------
NGC  1262    03:15:33.70 -15:52:48.0  .SXS5*.   n1262
dssget  48.890415 -15.880000 10.0 dss poss1_red
RAdeg,DECdeg,l,b:   48.8904152 -15.8800001    201.820  -54.790
Btot,DIA(armin),b/a,V:    15.00     0.83   0.794     -999.0
T, B-Vt, U-Bt :     5.00     0.79  -999.00
Other names:
   NGC  1262
   MCG -3- 9- 14
   IRAS03132-1604
   PGC 12107

Hence, RA,DEC in degree units:
% cdsex 03:15:33.70 -15:52:48.0 dd
 48.890417 -15.880000000 dd
As of Mar2023 am still struggling with extracting a one dimensional spectrum from these data.
Below are two finder charts for the NGC1262 field.
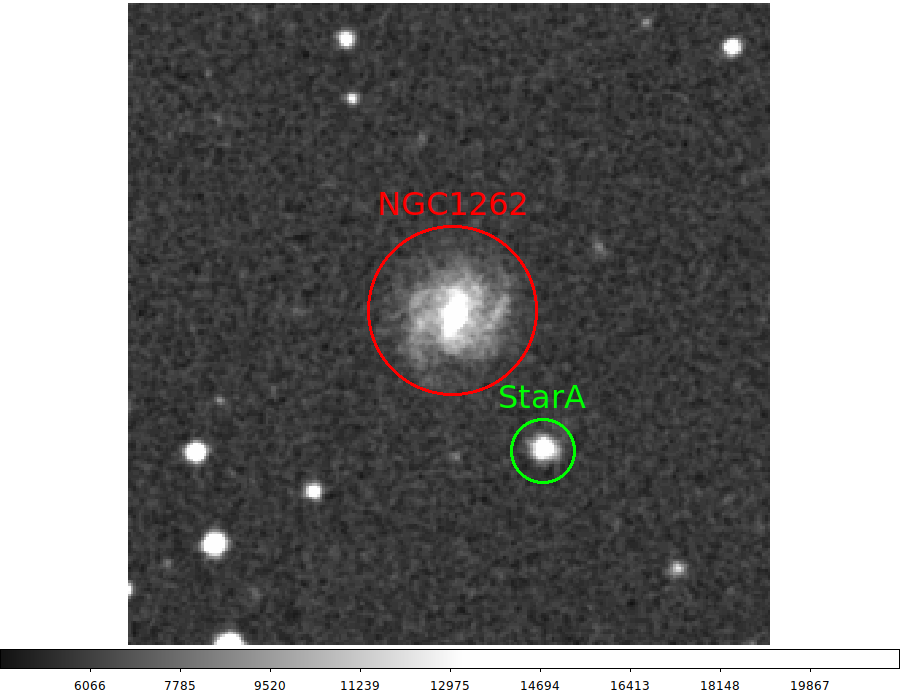 |
Figure 1: The DSS image of the NGC1262 field. The FK5 J2000 coordinates from this image:
  NGC1262        03:15:33.63  -15:52:44.0
  StarA          03:15:31.26  -15:53:35.9

  NGC1262_cube   03:15:33.59  -15:53:46.45
  StarA_cube     03:15:31.22  -15:53:34.6
This is an image from POSS-II and is a red (IIIa-F) band. The IIIa-J emulsion
image (blue) may show more spiral structure, but the E image does contain the
H-alpha line. Note that I also show the WCS values taken from Ann Isaac's VIRUS-P
cube of NGC1262.
|
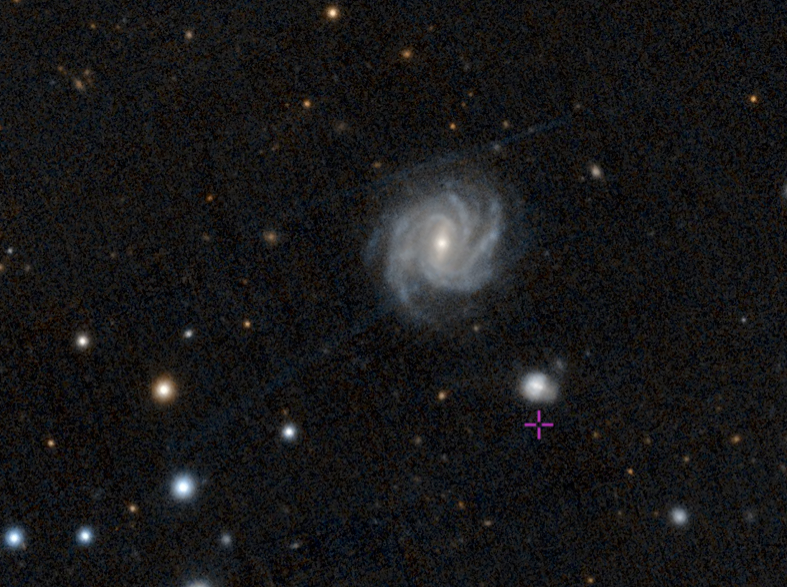 |
Figure 2: This is a color image I received from Jimi Lowrey. of the NGC1262 field.
This is probably a color composite from the PS1 (first epoch PANSTARRS) of the NGC1262 field. Jimi's note
is shown below:
  Steve in the image below South East of 1262 above the + is an interacting pair of
galaxies on the Poss II they look like a star. I am not sure if this is what you and
Ann were discussing in your note? They look to be far in the back of NGC 1262.
Hence, on the basis of the DSS chart above, and the VIRUS-P spatial image(s) below
(Figures X and X), what I have been calling "StarA" is actually a background galaxy!
I had been wondering why the extracted spectrum from NGC1262_pyPipe3D.fits (Anns's
spectral cube) did not look like a star. Hence, it would appear that the two
emission lines I see in the Star spectrum are real. This may serve as a udeful check
on the wavelength calibration for NGC1262_pyPipe3D.fits.
for us.
|
Jump to top, bottom, qlist
Using an old GregZ code for LRS2-B.
An sent a data cube on Jan30,2023 and a spatial image from that cube is shown below.
See sco2019 data files in: /home/sco/VIRUS-P/NGC1262_cube/T3
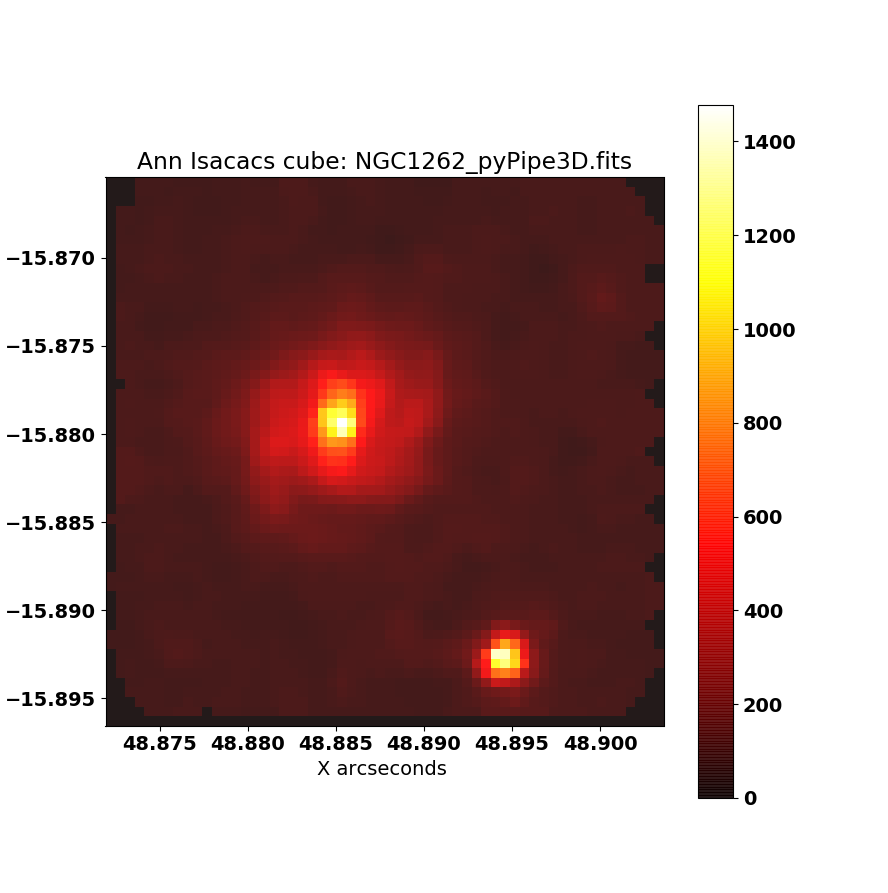 |
Figure 3: A spatial image of the NGC1262 data cube from Ann Isaacs (data obtained with
VIRUS-P in late Nov2022). I have used an old python code (slightly modified by SCO)
from GregZ to construct the integrated spatial image from NGC1262_pyPipe3D.fits.
See data on sco2019:  /home/sco/VIRUS-P/NGC1262_cube/T3
This spatial image was processed with:  gregz_002.py

Hence, RA,DEC in degree units:
% cdsex 03:15:33.70 -15:52:48.0 dd
 48.890417 -15.880000000 dd
The spatial image from gregz_002.py appears correct, but I am unable to extract
flux values in the 1-d file spectrum.dat (all flux values are 0.0).
|
The integrated spectrum is supposed to appear in the ASCII file named spectrum.dat, but
this seems to not happen correctly:
% cd /home/sco/VIRUS-P/NGC1262_cube/T3
% ls
A.fits	ax0.fits  bad.cards  d.fits  gregz_002.py  ngc1262_fig1.png  ngc1262_fig2.png  S/  spectrum.dat
% head -5 spectrum.dat
       wavelength flux_density
----------------- ------------
           3547.0          0.0
           3548.1          0.0
           3549.2          0.0
% tail -5 spectrum.dat
           5855.9          0.0
           5857.0          0.0
           5858.1          0.0
5859.200000000001          0.0
           5860.3          0.0
Jump to top, bottom, qlist
Using ds9 directly.
In the past I have been able to display and integrate a FITS data cube
directly with ds9. Here is the procedure:
See sco2019 data files in:    /home/sco/VIRUS-P/NGC1262_cube/T1

I got ds9.dat files:
 % ds9 NGC1262_pyPipe3D.fits

  - draw circle and double-click it
  - In pop-up circle box go to Analysis menu
  - select "Plot 3D"
  - in pop-up window select File > SaveData
  % cubespec.sh ds9.dat Y
The problem here seems to be that my output file (ds9.dat) does not contain
valid wavelength values. See the figure below.
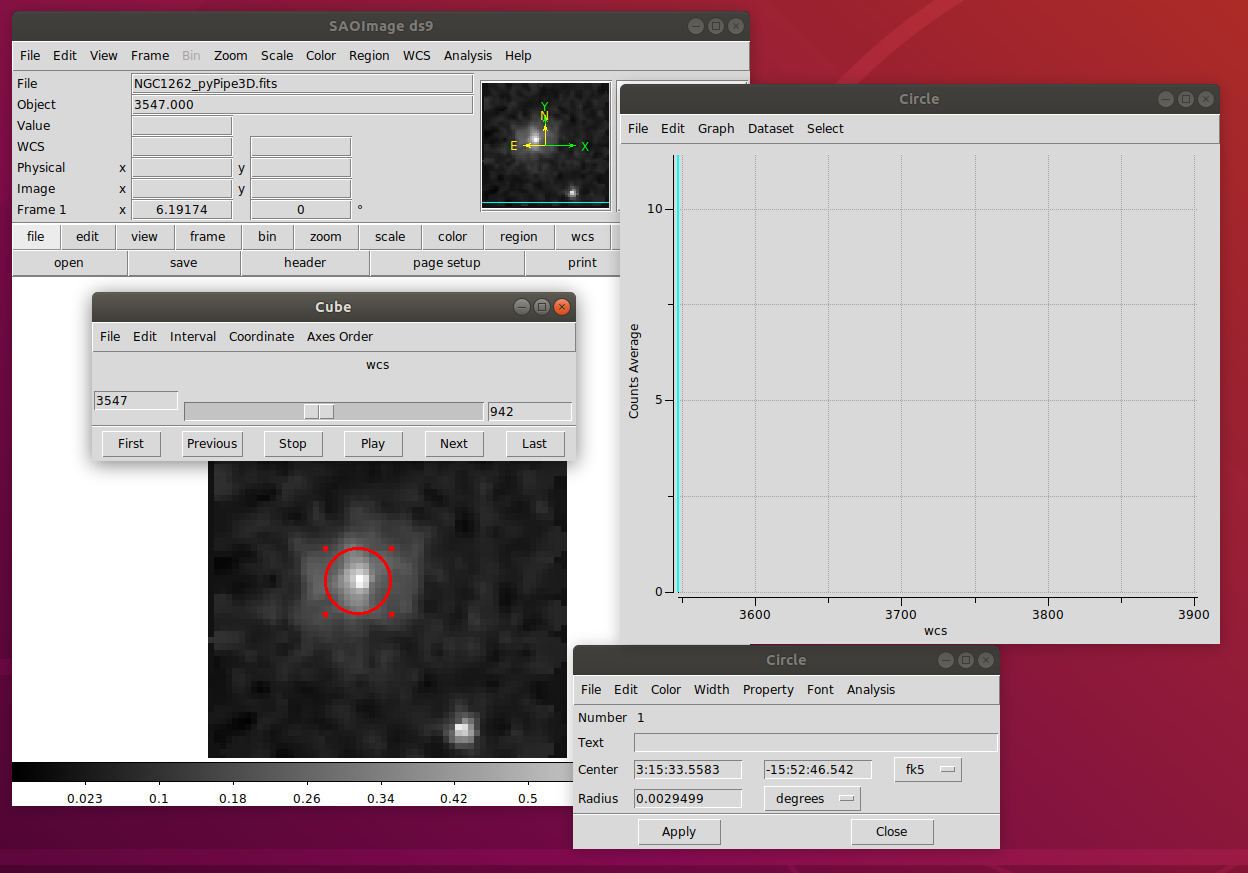 |
Figure 4: A spatial view with ds9 of the NGC1262 data cube from Ann Isaacs.
% ds9 NGC1262_pyPipe3D.fits
The spectrum X-axis values are all one fixed value at 3547 Angstroms.
|
The file ds9.dat is supposed to contain the spectrum derived by averaging all fibers
in the red circle marker dranw above. However, we get a fixed wavelenght of 3547 Angstroms
for every pixel.
% cd /home/sco/VIRUS-P/NGC1262_cube/T1
% head -5 ds9.dat
3547.0 0.0
3547.0 0.0
3547.0 0.0
3547.0 0.0
3547.0 0.0
% tail ds9.dat
3547.0 0.38378926456730045
3547.0 0.39511737162267724
3547.0 0.40593024330631
3547.0 0.41680604626161954
3547.0 0.42299460781873294
3547.0 0.414590183390128
3547.0 0.4166086705873884
3547.0 0.4196542533903303
3547.0 0.45671516001412055
3547.0 0.0
I can fix the wavelengths in post-processing, but a big question is this:
Has the wavelength axis been rectified in the data cube? .
In other words, maybe I just use the header values of CRPIX3, CRVAL3, and CDELT3 to
"fill in" the linear wavelength values in the ds9.dat file. Sloppy, but possible????
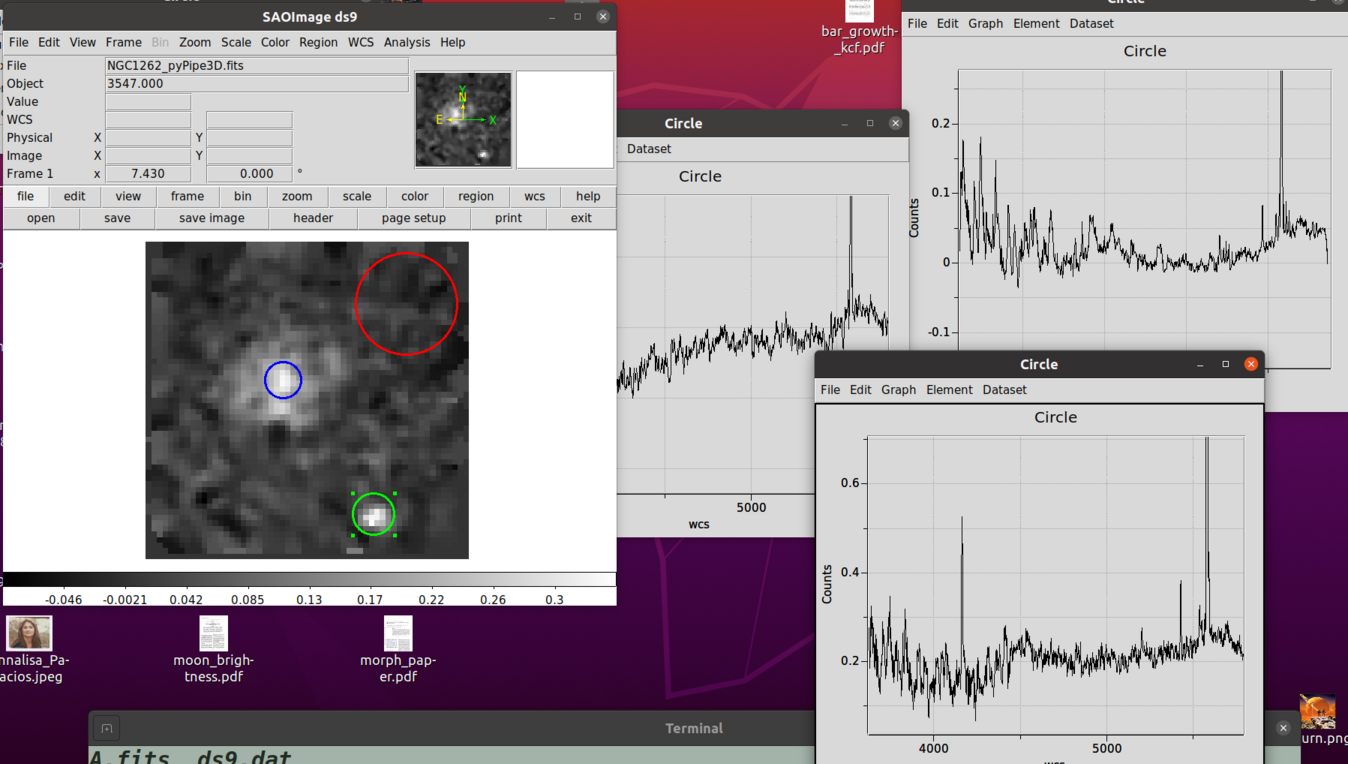 |
Figure 5: A spatial view with ds9 of the NGC1262 data cube from Ann Isaacs that I ran on my steveo laptop
using v7.1 (ds9). This is older than the zeus version, but it runs. The galaxy nuclues (blue)
has a spectrum plotted to the furthest left (labeled circle). A sky aperture (red) has a spectrum
plotted in the upper right. A star (green) aperture has a spectrum plotted in the lower right.
  machine      ds9 version      comments
   steveo        v7.1          spectrum integration does work
   sco2019       v8.0.1        does not work
   zeus          v8.2.1        does not work
I have no idea why the more modern versions of ds9 will not work properly with the
FITS cube image from Ann. but I'll just extract aperture-integrated spectra on the laptop.
|
Jump to top, bottom, qlist
Using ds9 to make a regions file for apertures.
I will establish (on sco2019) a ds9 regions file that sets up circular apertures on
the NGC1262 data cube (NGC1262_pyPipe3D.fits).
See sco2019 data files in:    /home/sco/VIRUS-P/NGC1262_cube
% ds9 NGC1262_pyPipe3D.fits
% mv ds9.reg NGC1262_pyPipe3D_apset1.reg
<
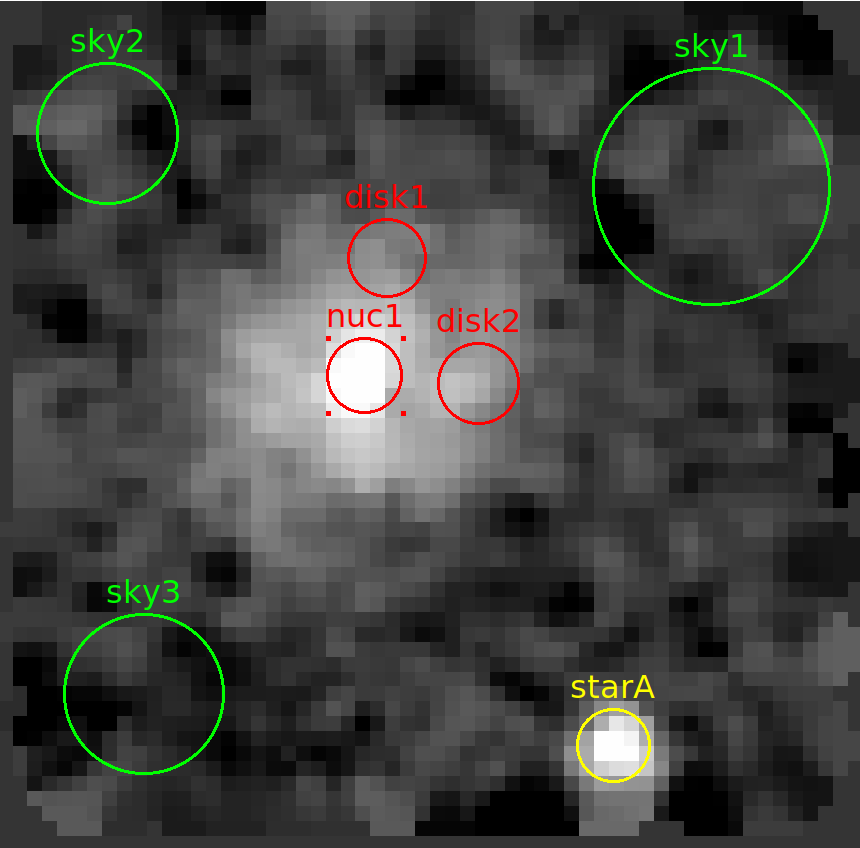 |
Figure 6 A ds9 view from NGC1262_pyPipe3D.fits with spectral measurement apertures marked.
I can measure average spectra in these apertures with ds9 v7.1 on my laptop:
 - double click the aperture to be measured.
 - in the "Circle" pop-up window, select Analysis/Plot_3D
 - in the pop-up spectrum window select File/Save_Data, then press OK button
 - mv ds9.dat to a unique name (e.g.   mv ds9.dat ds9_nuc1.dat)
Here are the files I savedd on the laptop (steveo):
   ds9_nuc1.dat
   ds9_disk1.dat  ds9_disk2.dat
   ds9_sky1.dat   ds9_sky2.dat     ds9_sky3.dat
   ds9_starA.dat

These ASCII text files of the spectral data I save on sco2019:
% cd /home/sco/VIRUS-P/NGC1262_cube/Apset1
% ls
ds9_disk1.dat  ds9_nuc1.dat  ds9_sky2.dat  ds9_starA.dat
ds9_disk2.dat  ds9_sky1.dat  ds9_sky3.dat  NGC1262_pyPipe3D_apset1.reg
Once the apertures are integrated, I have one-dimensional spectra that will be used to
derive a redshift for NGC1262. These files have no header information, so I'll build
a script that makes a table file for each *.dat file.
|
You can retrieve a tarball of these data files with this link.
In this way I can make a simple xyplotter file to display everything together. I use the code
ds9_apspec_tables.sh to process these files and
make table files. I am currently developing spectrum_tables.sh
that will be used to apply a final sky correction to the "nuc1" spectrum for NGC1262. Hopefully
we'll be able to identify some clear spectral features at that stage.
Jump to top, bottom, qlist
Jump to top of page
Back to calling page