
R-Band Photometry of Potentially Hazardous Asteroids at McDonald Observatory
Judit Györgyey Ries,
U. Texas at Austin/McDonald Observatory
Ferenc Varadi, UCLA/Institute of Geophysics and Planetary Physics
Edwin Barker, NASA/Johnson Space Center
Peter Shelus, U. Texas at Austin/Center for Space Research
Presented at the AAS 204th Meeting, June, 2004
Abstract
The McDonald Observatory Near Earth Object (NEO) group has been involved in confirmation and follow-up efforts since 1995.
Expanding this program from astrometry to astrophysics, we are attempting to derive refined absolute magnitudes, rotational
periods, and, whenever possible, axis ratios for Potentially Hazardous Asteroids (PHAs). Our test case, 2002 EZ11 was observed
on 2003 February 17, during full Moon (Ries et al., 2003). Using the relative photometry we analyzed 76 images, and detected a
total peak to valley brightness variation of 0.15 magnitude in the Johnson R filter with an internal precision of ± 0.02 magnitude.
The rotational period of 1.16 hours was found using Singular Spectrum Analysis (Ghil et al., 2002), which has proven to perform
quite well on short, noisy time series. Some of the several other targets that we have observed are 2003 SS84 and 65803 (1996 GT).
These PHAs were also observed at Arecibo and Goldstone. Our preliminary analysis of 8 hours worth of data for 65803 shows a
peak-to-valley change of 0.24 magnitude, with irregular, smaller (i.e., 0.05-0.07 mag) variations superimposed. In the case of 2003
SS84 we detected a variation of 0.3 magnitude or greater in a seven hour span. The final results will be presented at this meeting.
This research is funded by NASA's NEO Observation Program Grants NAG5-10183 and NAG5-13302.
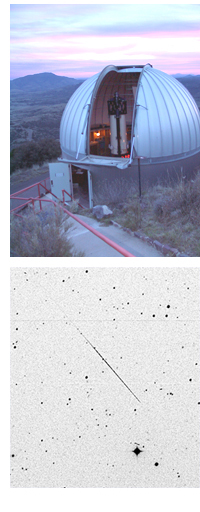
Observing
We have obtained our CCD images with the 0.76 meter telescope equipped with the Prime Focus Corrector through a standard Johnson
R filter. Each exposure covers a 45 arcminute x 45 arcminute area of the sky. Observing conditions differed widely for the
different objects, such as lunar phases or sky transparency. Asteroids are the brightest at or near opposition; however, they
usually move the fastest on the sky at the same time. We adjust the Right Ascension trackrate of the telescope by a large
amount to maximize the object's signal-to noise ratio. This results in a more circular asteroid image, and trailing stellar images.
The telescope cannot track in Declination, thus at longer exposures the asteroid images can also be trailing. The gaps in the data are
usually due to switching targets to observe a Minor Planet Center NEO Confirmation Page object as a part of our NEO Astrometry program.
Data Reduction
The large field of view assures that we find a sufficient number of candidates for reference stars with constant brightness. We
automated the reduction process by using R values published in the USNO B1.0 catalog. Instead of picking individual stars with
parallel variations in instrumental magnitude due to changing sky conditions, we use the averaged value of the measured instrumental
and catalog magnitudes to obtain the on-site or quick-look light curves. While the catalog is not meant to be photometric and might
have an offset between areas of the sky far apart, it has a large number of stars available on any field to eliminate stars for which the
catalog and instrumental magnitudes are not consistent.
First we extract from the catalog stars which widely bracket the estimated V magnitude of the target and remove those pairs of stars
from the file which are closer than 20 arcseconds, reducing possible sky contamination in the automated photometry. Using the NOAO
IRAF PHOT package we measure all the remaining stars. If we ignore an unknown offset, the instrumental magnitude is a representation
of the actual brightness, and we use the linear fit of the catalog magnitudes to the instrumental values to remove 2.7 sigma outliers.
PHOT allows us to chose only circular apertures, while the stellar images can be quite elongated due to the fact that we adjusted the
telescope trackrate to follow the asteroid. This may introduce a bias into the derived instrumental magnitude of the target on a given plate.
However, the point spread function of the stellar images on a given plate is quite constant, and we can measure them with the same set
of photometric parameters. It is reasonable to assume that this bias is about the same for all the measurements of the target, introducing
some noise but not affecting the lightcurve amplitude or period. The corrected R magnitude of the target is given
by Mc = Minst-(Mplate-Mcat), which still has a
zero point offset from the actual magnitude, but we are interested only in the period and the amplitude of the variations.
This quick-look method works quite well (see insert). When the signal is less clear, we can refine the reduction by finding all the
stars common on each plate and using the averages of this subset only. (For very fast moving object, such as 2002 EZ11, we need to
break up the plates into overlapping sets.) This part of the reduction still needs to be automated.
 To test the robustness of our reduction, we compared the lightcurves of 2001 CC21 using different photometric parameters, reference
star editing and purely catalog based R magnitude determination. The resulting curves are offset, since the reference magnitudes are
different, but the resulting lightcurves parallel each other nicely. The quick-look value is based on the USNO A2.0 catalog during the
astrometric reduction. The on-site data allows us to obtain a fast check whether we see sufficient amount of variation to continue with
the observations.
To test the robustness of our reduction, we compared the lightcurves of 2001 CC21 using different photometric parameters, reference
star editing and purely catalog based R magnitude determination. The resulting curves are offset, since the reference magnitudes are
different, but the resulting lightcurves parallel each other nicely. The quick-look value is based on the USNO A2.0 catalog during the
astrometric reduction. The on-site data allows us to obtain a fast check whether we see sufficient amount of variation to continue with
the observations.
Minor Planets Observed
|
Designation |
Type |
Date of Obs. |
|
H |
|
|
Period (hours) |
|
|
PHA |
|
10 |
18.4 |
13.4 |
0.2 |
2.22* |
|
|
NEO |
|
250 |
18.6 |
17.5 |
0.95 |
5.02 |
|
|
PHA |
|
60 |
18.1 |
15.6 |
0.15 |
2.32 |
|
|
|
|
|
|
|
ΔMR (approx) |
|
|
|
PHA |
|
230 |
21.8 |
18.1 |
0.4 |
TBD |
|
|
PHA |
|
320 |
19.3 |
18.2 |
1.5 |
TBD |
|
|
PHA |
|
35 |
19.4 |
15.5 |
≥0.4 |
TBD |
|
* High frequency component |
|||||||
Corrected Lightcurves


1996 was observed by the Arecibo radar and among others Ondrejov, Czech Republic and Kiso Observatory Japan. Pravec et al. have determined the orbital period of this binary, and the rotational period of the primary. Our data is not long enough to recover the 11.9 h rotation period, but we agree well on the primary's rotation period (2.26 h.)
Period Determination
Common methods that can be applied to determine the rotational period of an asteroid include Fourier harmonic fitting or phase dispersion
minimization. The former assumes that the light curve can be approximated with a few sinusoids and both require a relatively high
signal-to-noise ratio. Since some of our data set is fairly noisy, we used Singular Spectrum Analysis (SSA; Ghil et al., 2002), which has been
originally developed to deal with short (a few dozen data points) and noisy time series in geophysics.
SSA decomposes the time series using the eigenvalues and eigenvectors of a matrix whose elements are lagged autocorrelations.
The largest eigenvalues correspond to the largest oscillatory components in the time series, while the smaller ones to noise. A single
dominant oscillation is usually represented by a pair of eigenvalues of similar magnitudes. The eigenvectors associated with eigenvalues
provide finite impulse response (FIR), or moving average filters which are used to extract parts of the time series. Filtering with the
eigenvectors of the largest eigenvalues reconstructs the strongest signals above noise. The filters are data-adaptive and not
necessarily sinusoidal. The reconstructed (de-noised) components are essentially local, moving least-squares fits of the eigenvectors
to the data, and can accommodate modulations in the amplitudes of the oscillations. The maximum lag for the matrix of autocorrelations
(window length) is a parameter which is usually chosen to be about one third of the length of the time series.
Our test case was 2002 EZ11. We determined a straightforward Fourier spectrum and SSA. Straightforward Fourier spectra for
the two original, interpolated time series and the two reconstructed components are shown below. While the original data has one
dominant peak and several small ones, the spectra of the reconstructed components appear to be much cleaner.
We note that while Fourier analysis and SSA both find the same oscillation as the dominant one, especially for 2001 CC21
for which the signal is strong, this is not always the case. The periods of rotation were determined by oversampling the
Fourier spectra of the reconstructed components in frequency. The first analysis of 2002 EZ11 gives 1.161 hours as
the period of rotation, while the second gives 1.173 hours. The difference is less than the length of the exposures, and
within the range of what can be expected for a time series of about 75 points. For 1996 GT we have a higher amplitude signal
and 120 points, and we get identical results from the two types of analysis.
Future Work
| Follow-up on: | |
|
|
| Refine: | |
|
|
| Refine and follow-up on: | |
|
|
- Continue to automate the objective iterative process to eliminate the large amplitude variable stars from the reference stars. Given the large number of stars available (>100), we expect an improvement in the relative photometry between frames.
- Connect the observations from two consecutive nights (when available) to refine the period.
- Use images of Landolt photometric standards obtained during photometric nights to calibrate the offset of the lightcurves presented.
References
Ghil, M., R. Allen, M. Dettinger, K. Ide, D. Kondrashov, M. Mann, A. Robertson, A. Saunders, Y. Tian, F. Varadi, and
P. Yiou, Advanced spectral methods for climatic time series, Reviews of Geophysics, 40(3), 1-41, 2002.
Kitazato, K., et al., Photometric behaviour dependent on solar phase angle and physical characteristics of binary
Near-Earth Asteroid (65803) 1996 GT, Lunar and Planetary Science XXXV, 2004.
Pravec, P., A. Harris, T. Michalowski, Asteroids III, Eds. Bottke et al., 113-122, Arizona Press/LPI, 2003.
Pravec, P., L. Benner, M. Nolan, P. Kusnirak, D. Pray, J. Giorgini, R. Jurgens, S. Ostro, J.-L. Margot, C. Magri, A. Grauer, and S. Larson,
International Astronomical Union Circular (65803) 1996 GT, 2003.
24 January 2006
CNS Help Request · web accessibility policy · web privacy policy